> ## Documentation Index
> Fetch the complete documentation index at: https://intunedhq.com/docs/llms.txt
> Use this file to discover all available pages before exploring further.
# Monitoring and traces
## Overview
Intuned provides full visibility into your automation Runs. See what parameters were used, what results came back, and what failed.
Track executions at three levels:
* **Runs**: Individual API executions with inputs, outputs, and status
* **Attempts**: Each retry within a Run, with logs and traces
* **JobRuns**: Batch executions containing multiple Runs
## View Run records
Every time you execute an API in Intuned, a **Run** record is created. A Run represents a single logical execution and tracks:
* Input parameters and configuration (timeouts, retries, auth settings)
* Execution status and timing
* Output results or error details
* All retry attempts made during execution
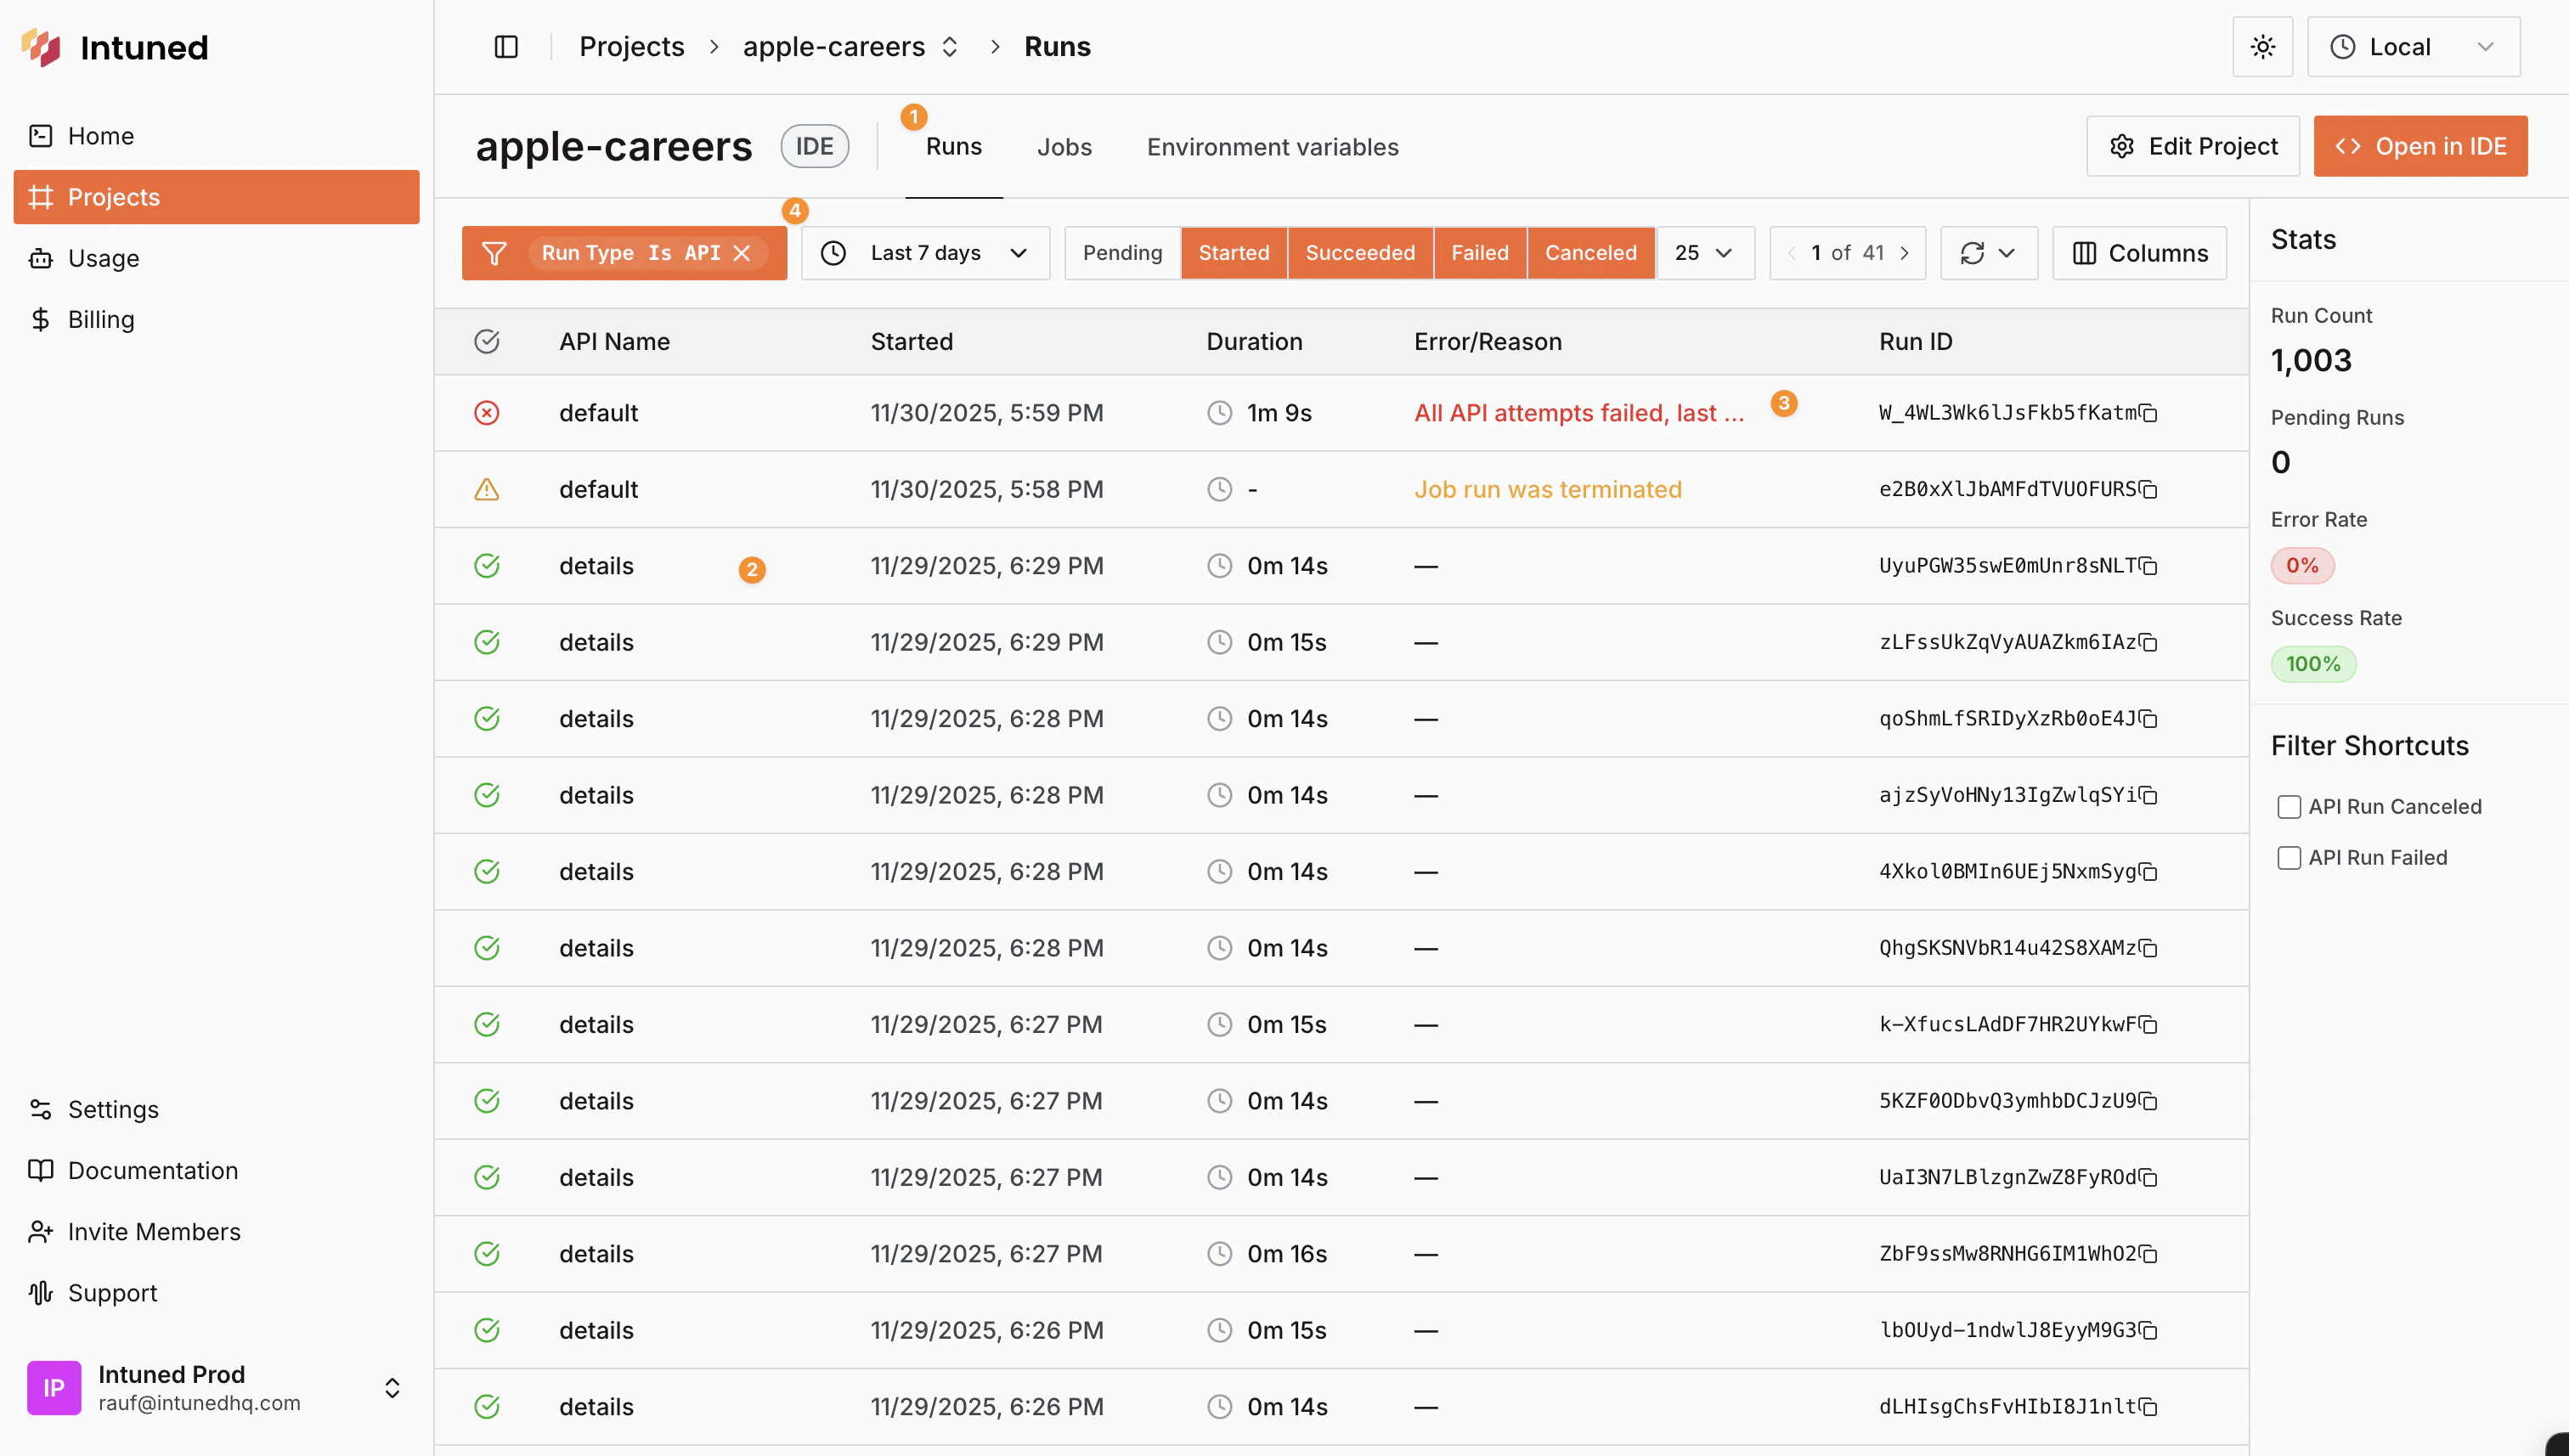 1. Find the Runs table in the **Runs** section of the project dashboard
2. Each Run row shows a single API execution with its status, timing, duration, and more
3. Scan failed Runs by checking the status and the related error/reason column. Check more about error types in our [error code reference](/main/05-references/error-codes)
4. Use the filters at the top to narrow down Runs by status, date range, job, API, and more
Use the Run ID to fetch Run details programmatically via the [Run result API](/client-apis/api-reference/projectsruns/run-api--result).
Use the CLI to list and inspect runs without opening the dashboard. Run from your project directory or use `-p `:
```bash theme={null}
# List recent runs
intuned platform runs list
# Filter by status or API name
intuned platform runs list --filter status=FAILED
intuned platform runs list --filter api_name=my-api
# Get details for a specific run
intuned platform runs get
```
See [Runs List](/main/05-references/cli/platform#runs-list) and [Runs Get](/main/05-references/cli/platform#runs-get) for all options.
### View Run details
Click any Run record from the table to open the Run details page. This page shows details about that specific API execution.
1. Find the Runs table in the **Runs** section of the project dashboard
2. Each Run row shows a single API execution with its status, timing, duration, and more
3. Scan failed Runs by checking the status and the related error/reason column. Check more about error types in our [error code reference](/main/05-references/error-codes)
4. Use the filters at the top to narrow down Runs by status, date range, job, API, and more
Use the Run ID to fetch Run details programmatically via the [Run result API](/client-apis/api-reference/projectsruns/run-api--result).
Use the CLI to list and inspect runs without opening the dashboard. Run from your project directory or use `-p `:
```bash theme={null}
# List recent runs
intuned platform runs list
# Filter by status or API name
intuned platform runs list --filter status=FAILED
intuned platform runs list --filter api_name=my-api
# Get details for a specific run
intuned platform runs get
```
See [Runs List](/main/05-references/cli/platform#runs-list) and [Runs Get](/main/05-references/cli/platform#runs-get) for all options.
### View Run details
Click any Run record from the table to open the Run details page. This page shows details about that specific API execution.
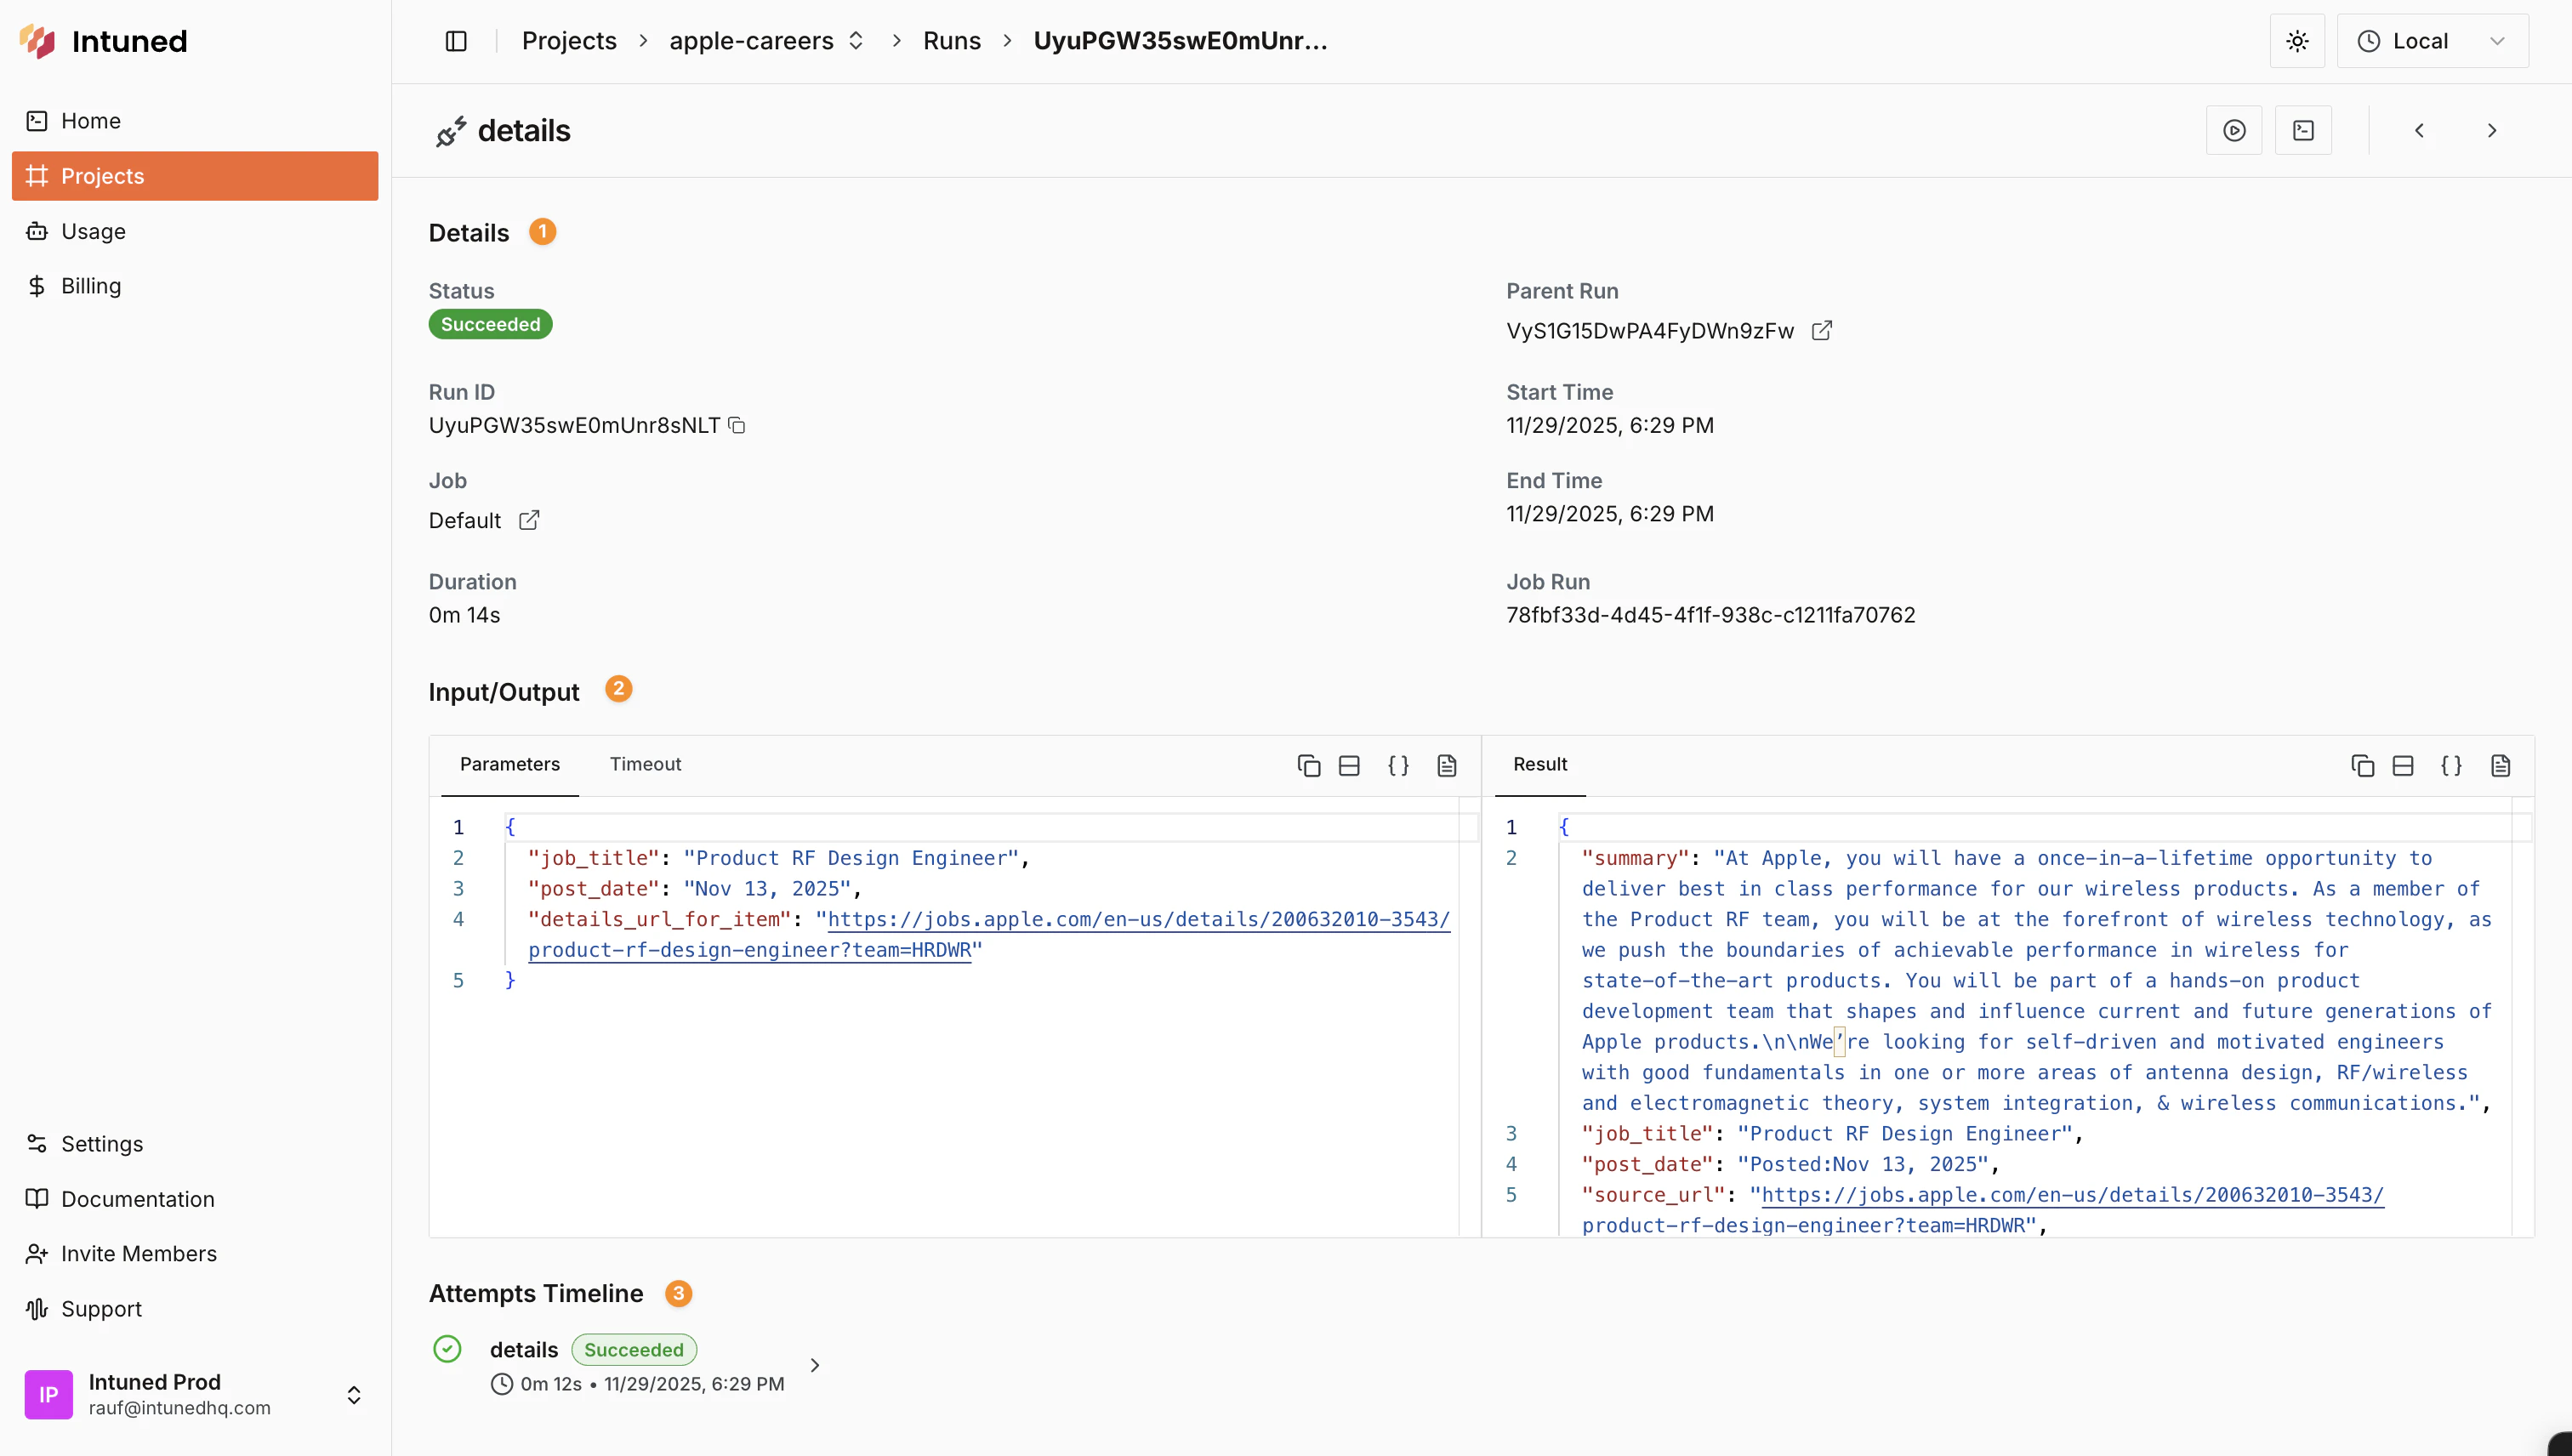 1. **Metadata section**: Displays the Run's ID, status, duration, timing, associated Job and AuthSession (if any), and API name
2. **Input/Output section**: Split into two panels, this section shows the input parameters used for the Run on the left and the output results on the right. You can switch between different tabs to view results, extended payloads, errors, and more
3. **Attempts Timeline**: This visual timeline shows all attempts made for this Run, including their statuses, durations, and timestamps. Click any attempt to view more details, including logs and traces. Learn more about the [attempts and dependencies execution model](/main/00-getting-started/how-intuned-works#runs-and-attempts).
### Runs with AuthSession
When a Run is configured to use an AuthSession, you'll notice additional fields and behaviors in the Run details page
1. **Metadata section**: Displays the Run's ID, status, duration, timing, associated Job and AuthSession (if any), and API name
2. **Input/Output section**: Split into two panels, this section shows the input parameters used for the Run on the left and the output results on the right. You can switch between different tabs to view results, extended payloads, errors, and more
3. **Attempts Timeline**: This visual timeline shows all attempts made for this Run, including their statuses, durations, and timestamps. Click any attempt to view more details, including logs and traces. Learn more about the [attempts and dependencies execution model](/main/00-getting-started/how-intuned-works#runs-and-attempts).
### Runs with AuthSession
When a Run is configured to use an AuthSession, you'll notice additional fields and behaviors in the Run details page
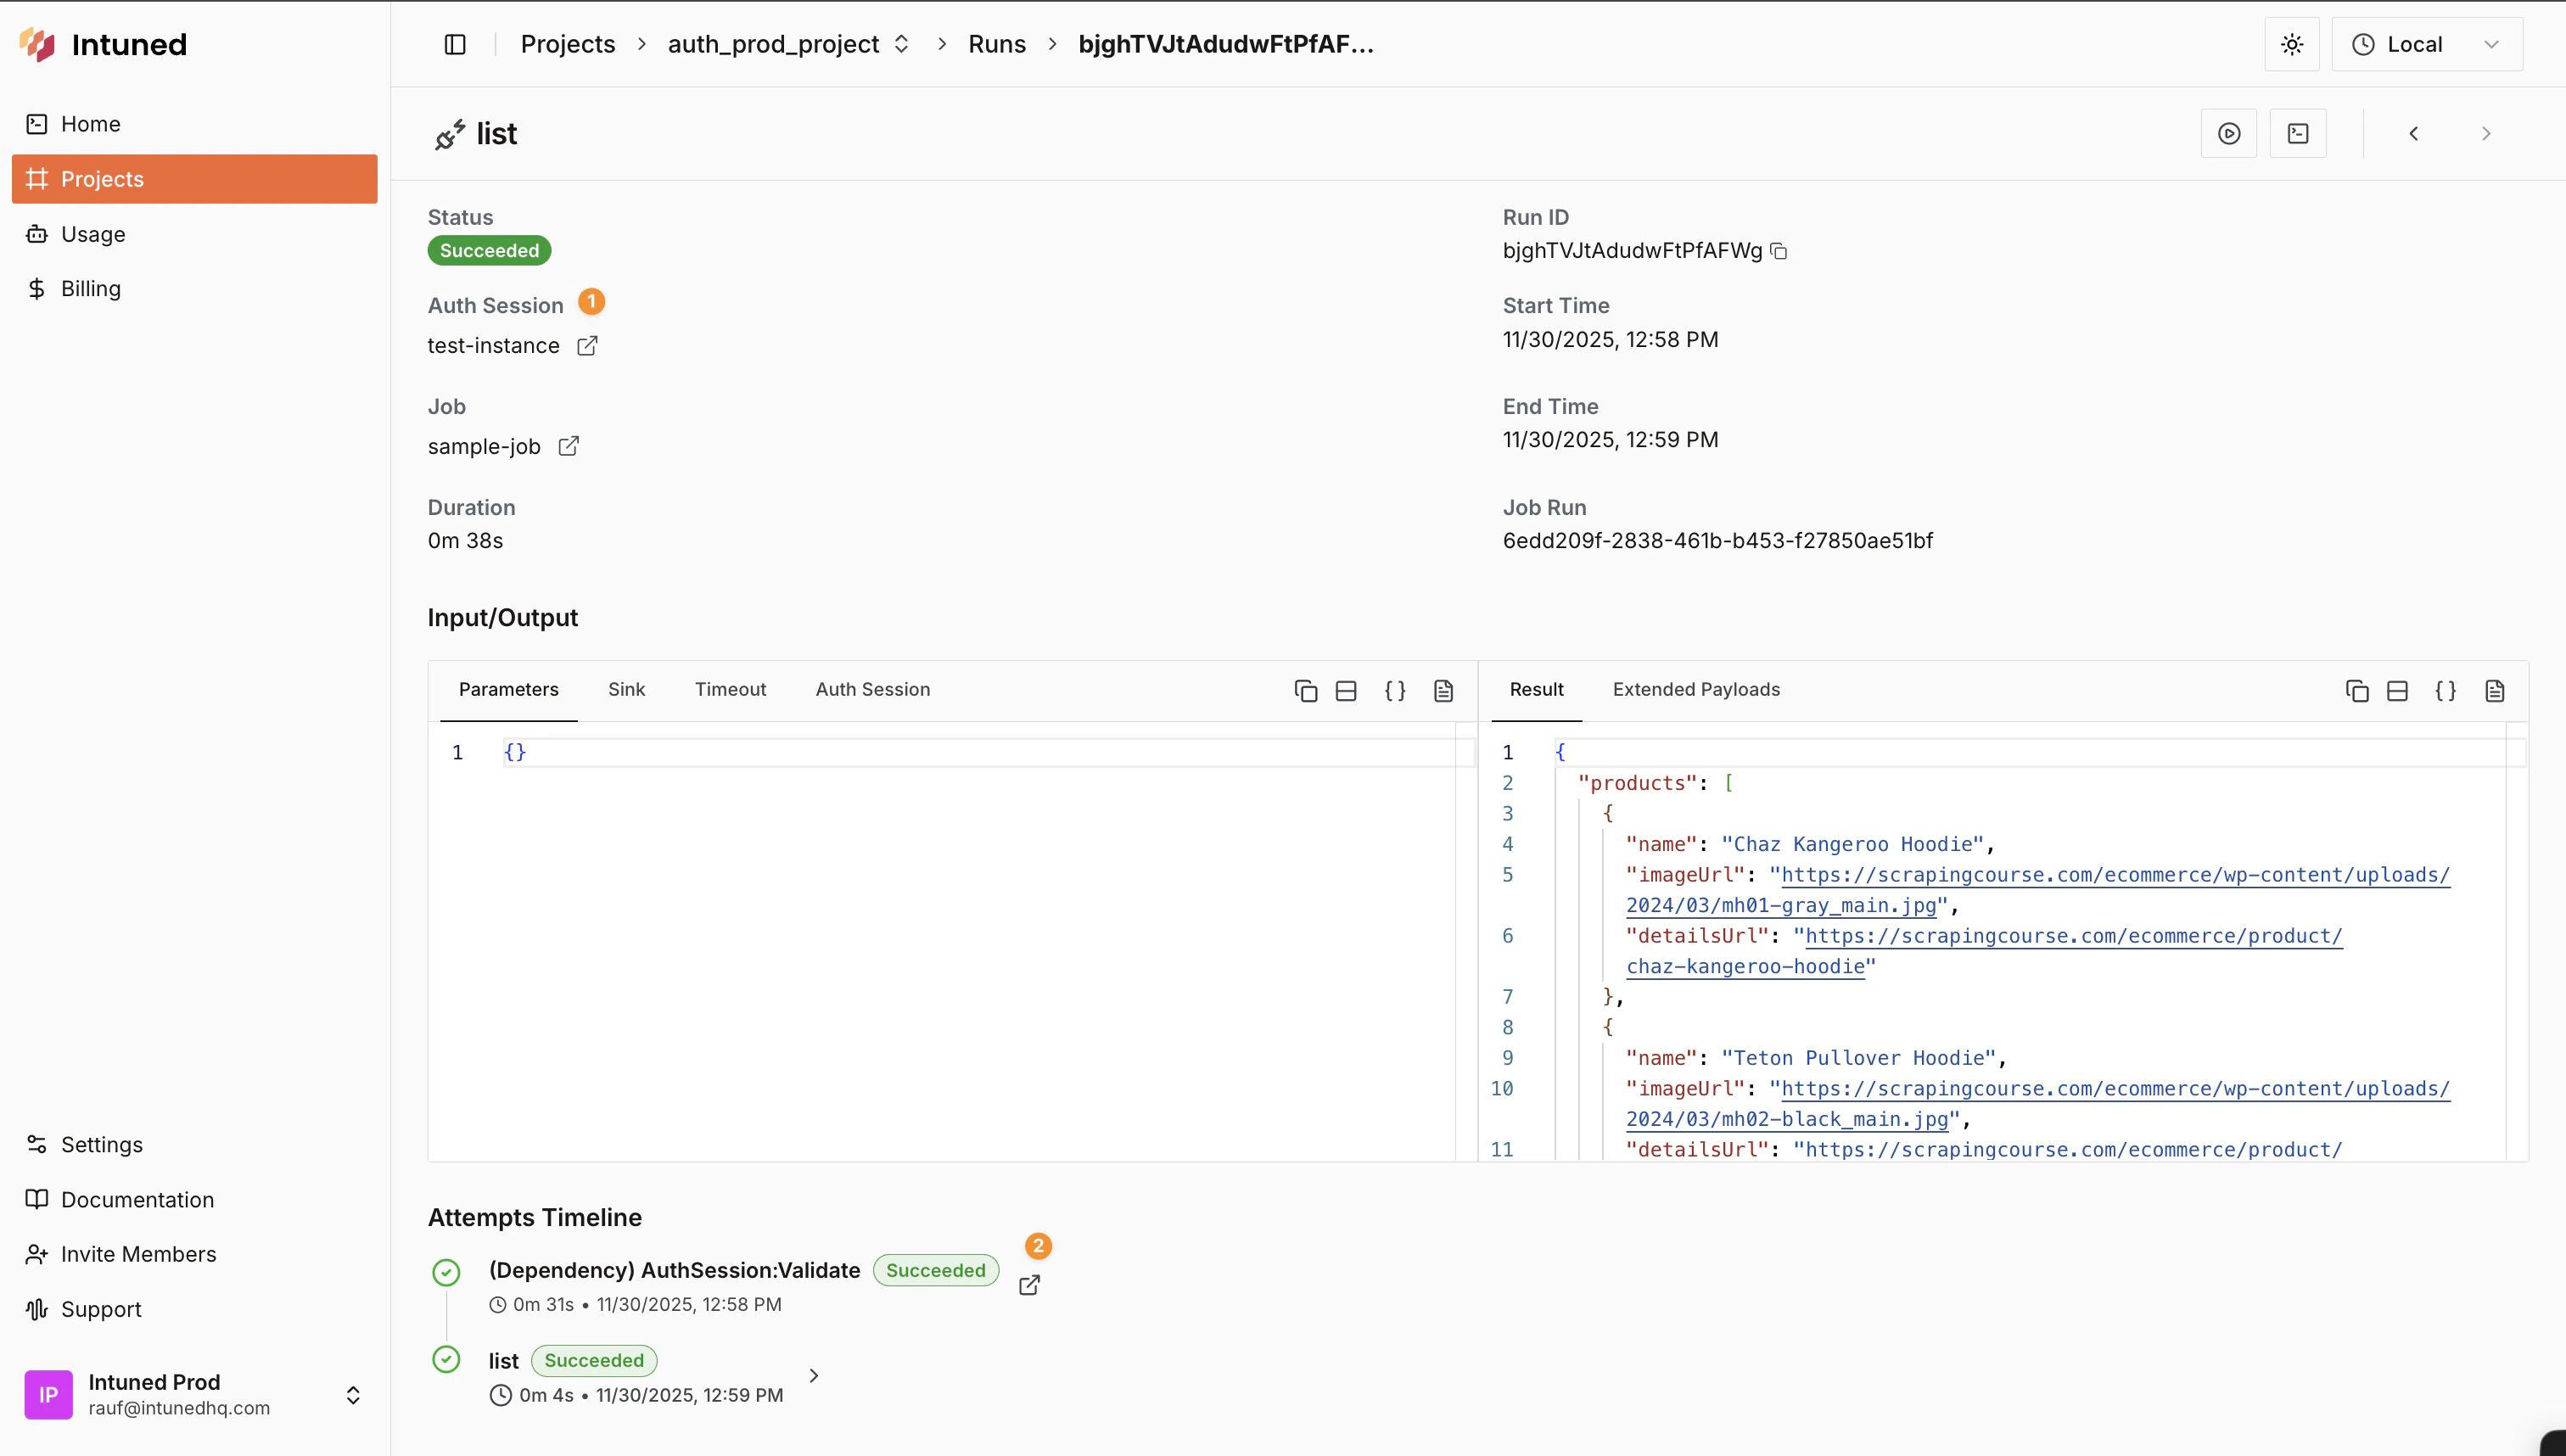 1. AuthSession field in the Metadata section indicates which AuthSession was used for this Run
2. `AuthSession:Validate` dependency appears in the Attempts Timeline before each API attempt to ensure the session is valid. Click it to view its own Run details. Learn more about [AuthSession](/main/02-features/auth-sessions).
## Inspect Run attempts
Each Run can have multiple **Attempts**, especially if retries are enabled or if there are dependencies involved (like AuthSessions). Each attempt represents a single try to execute the API automation.
1. AuthSession field in the Metadata section indicates which AuthSession was used for this Run
2. `AuthSession:Validate` dependency appears in the Attempts Timeline before each API attempt to ensure the session is valid. Click it to view its own Run details. Learn more about [AuthSession](/main/02-features/auth-sessions).
## Inspect Run attempts
Each Run can have multiple **Attempts**, especially if retries are enabled or if there are dependencies involved (like AuthSessions). Each attempt represents a single try to execute the API automation.
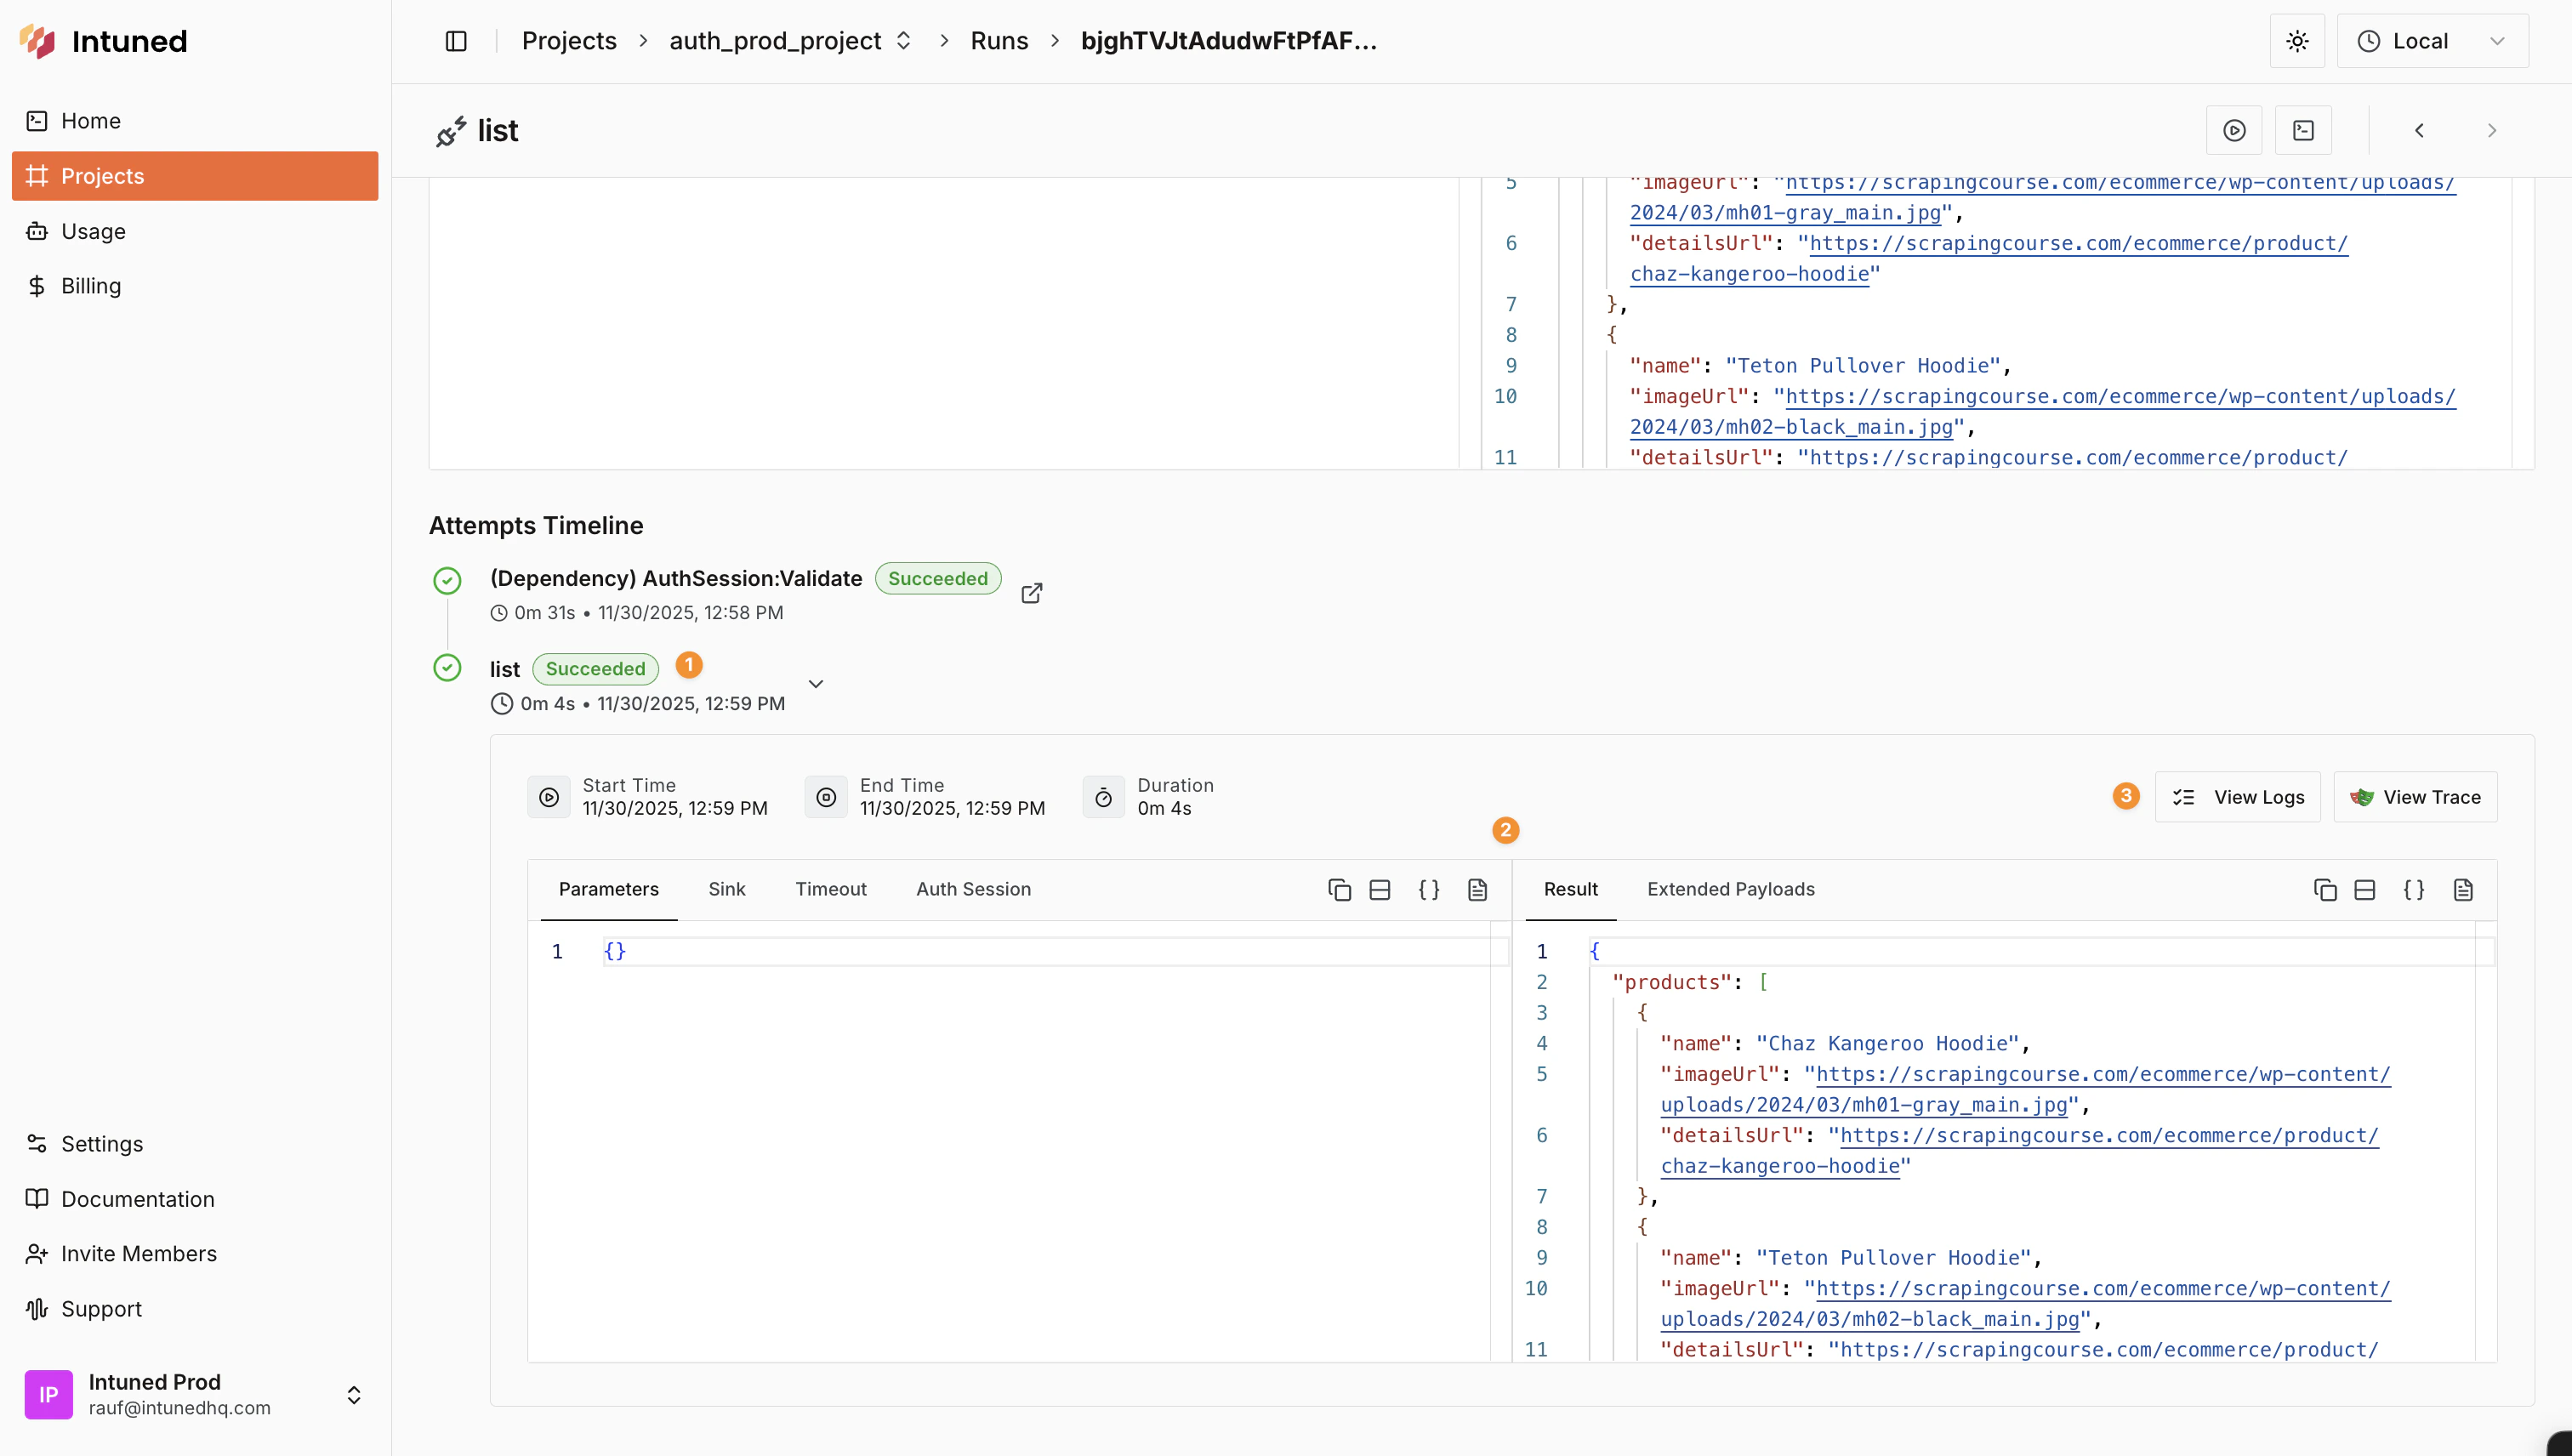 1. View the attempt entry in the Attempts Timeline, showing API name, status, duration, and timestamp
2. Click an attempt to view detailed input parameters and output results
3. Access logs and traces for debugging and analysis
### Debug failed attempts with traces
1. View the attempt entry in the Attempts Timeline, showing API name, status, duration, and timestamp
2. Click an attempt to view detailed input parameters and output results
3. Access logs and traces for debugging and analysis
### Debug failed attempts with traces
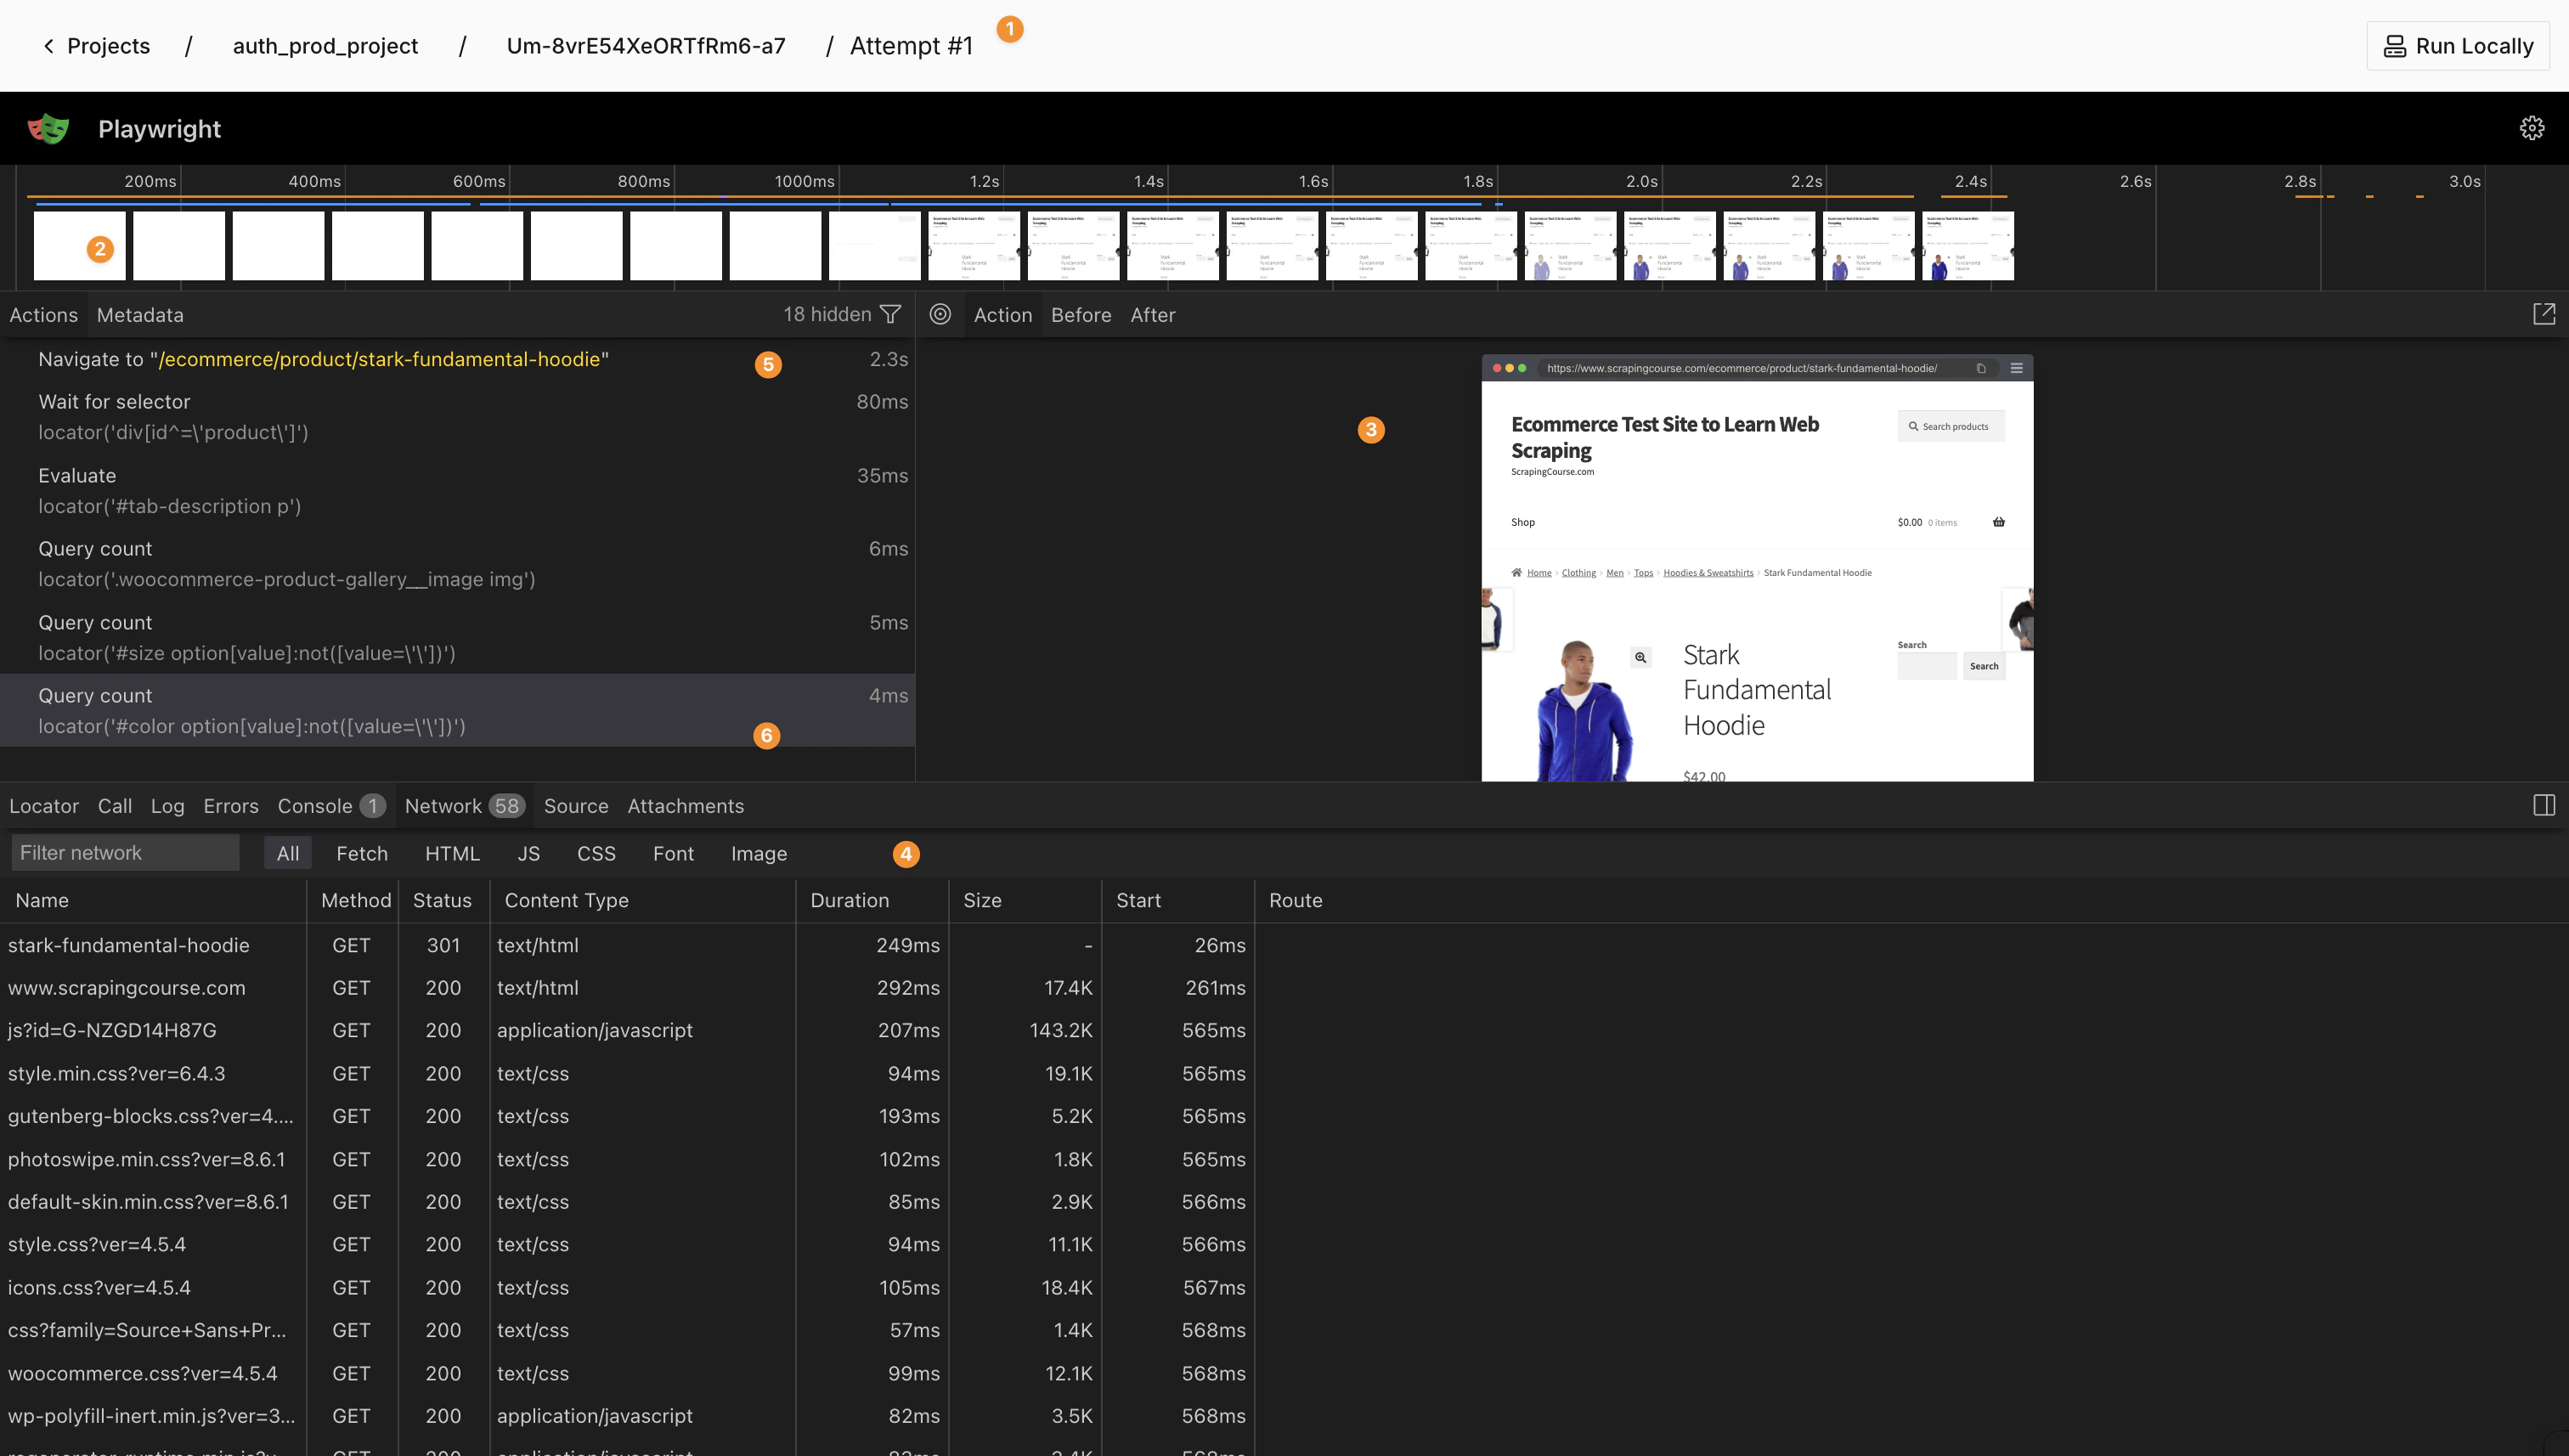 When an attempt fails:
1. Select **View Trace** for the failed attempt to open Playwright's trace viewer
2. Replay the browser session step-by-step
3. Check if a bot detection mechanism was triggered
4. Inspect network requests to see if any resources failed to load
5. Check DOM snapshots to understand the page state at each step
6. Analyze failed selectors or actions that caused the error
Download attempt logs and traces directly via the CLI. Run from your project directory or use `-p `:
```bash theme={null}
# Download automation logs for an attempt
intuned platform attempts log
# Download browser trace (Playwright .zip) for an attempt
intuned platform attempts trace
# If a run has multiple attempts, specify the attempt number
intuned platform attempts log 2
intuned platform attempts trace 2
```
See [Attempts Log](/main/05-references/cli/platform#attempts-log) and [Attempts Trace](/main/05-references/cli/platform#attempts-trace) for all options.
## Monitor JobRuns
In addition to individual API Run records, Intuned provides a way to visualize and monitor the execution of entire Jobs through **JobRun** records. A JobRun represents a single execution of a Job. It may include multiple API Runs. Learn more about [Jobs](/main/02-features/jobs-batched-executions).
### View JobRun details
Navigate to the **Jobs** section within your project. You'll see a list of all your defined Jobs. Click any Job to view its details.
When an attempt fails:
1. Select **View Trace** for the failed attempt to open Playwright's trace viewer
2. Replay the browser session step-by-step
3. Check if a bot detection mechanism was triggered
4. Inspect network requests to see if any resources failed to load
5. Check DOM snapshots to understand the page state at each step
6. Analyze failed selectors or actions that caused the error
Download attempt logs and traces directly via the CLI. Run from your project directory or use `-p `:
```bash theme={null}
# Download automation logs for an attempt
intuned platform attempts log
# Download browser trace (Playwright .zip) for an attempt
intuned platform attempts trace
# If a run has multiple attempts, specify the attempt number
intuned platform attempts log 2
intuned platform attempts trace 2
```
See [Attempts Log](/main/05-references/cli/platform#attempts-log) and [Attempts Trace](/main/05-references/cli/platform#attempts-trace) for all options.
## Monitor JobRuns
In addition to individual API Run records, Intuned provides a way to visualize and monitor the execution of entire Jobs through **JobRun** records. A JobRun represents a single execution of a Job. It may include multiple API Runs. Learn more about [Jobs](/main/02-features/jobs-batched-executions).
### View JobRun details
Navigate to the **Jobs** section within your project. You'll see a list of all your defined Jobs. Click any Job to view its details.
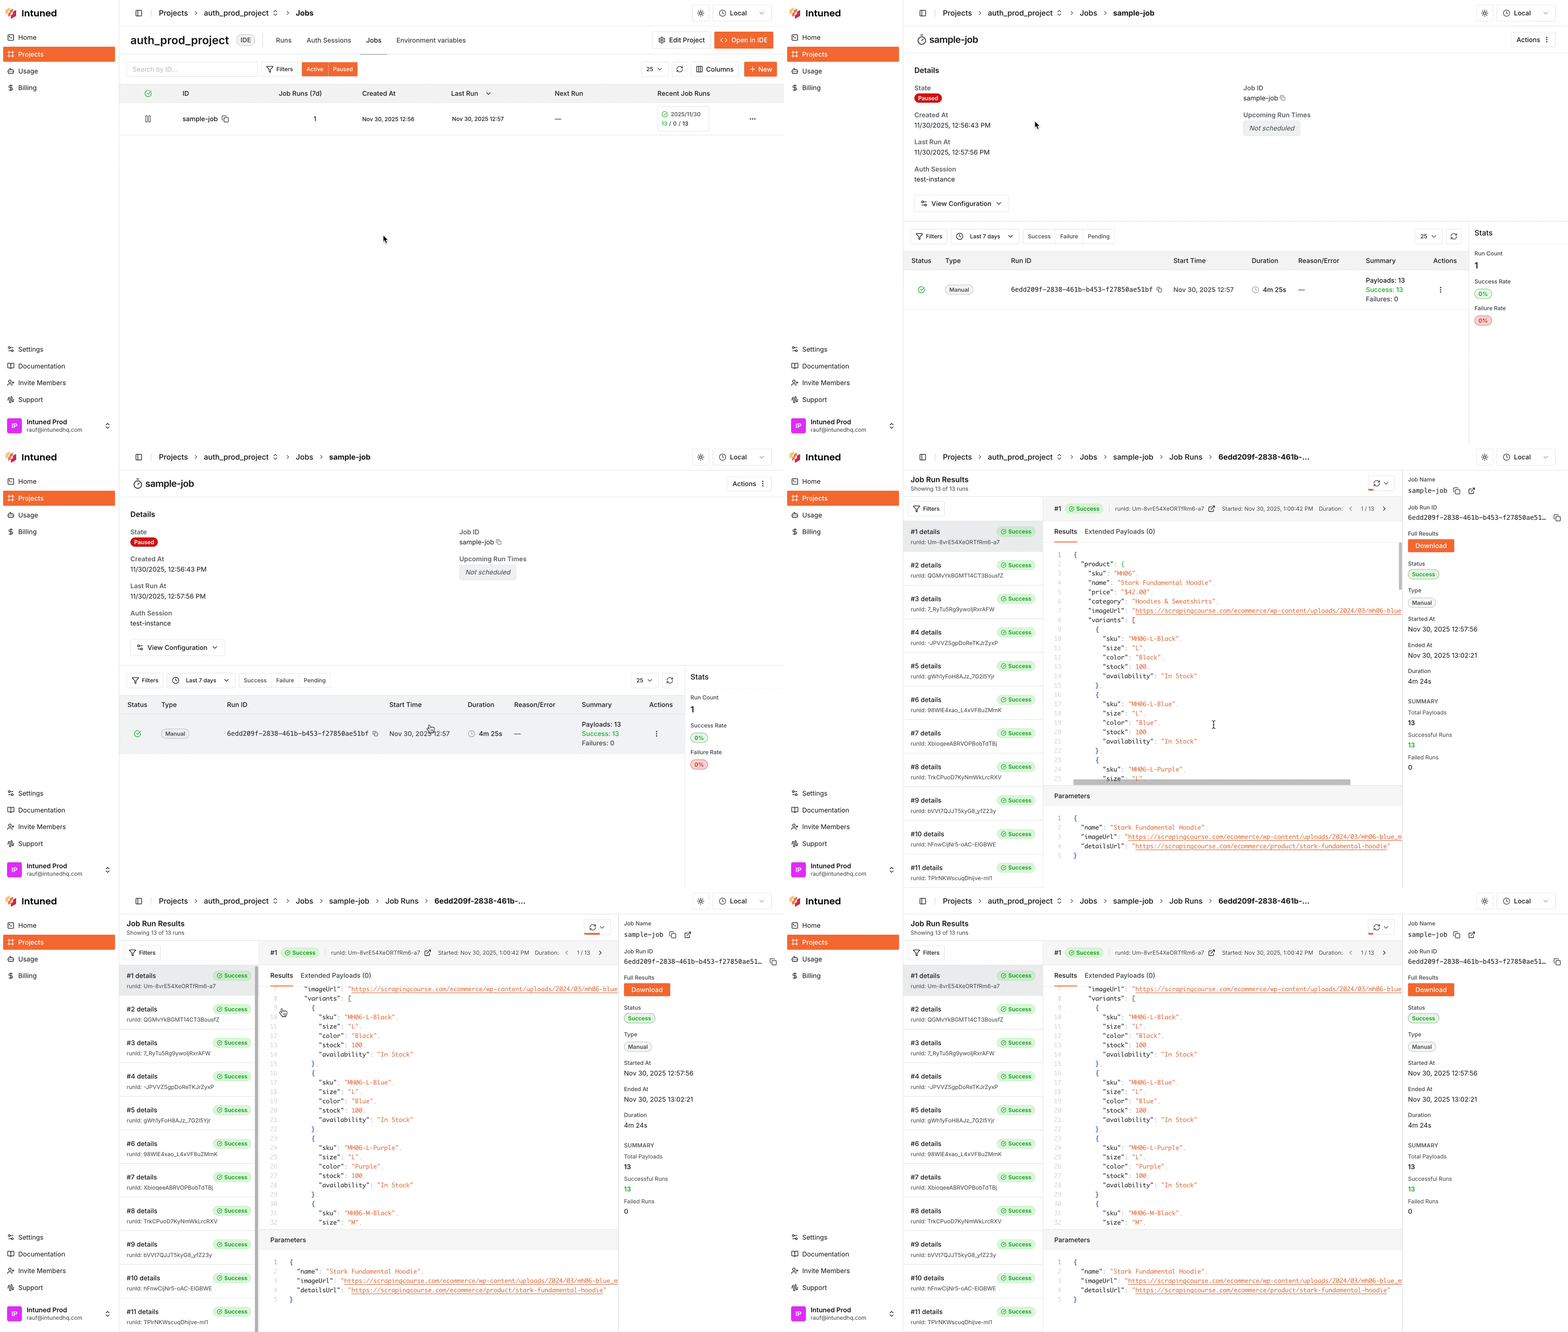 For each Job details page, you can view the job configuration, schedule, and more. You can also:
* Edit the Job configuration
* Trigger a JobRun manually
* Pause or resume scheduled executions
Below, view the **JobRuns** with a detailed summary of all payloads executed.
For each Job details page, you can view the job configuration, schedule, and more. You can also:
* Edit the Job configuration
* Trigger a JobRun manually
* Pause or resume scheduled executions
Below, view the **JobRuns** with a detailed summary of all payloads executed.
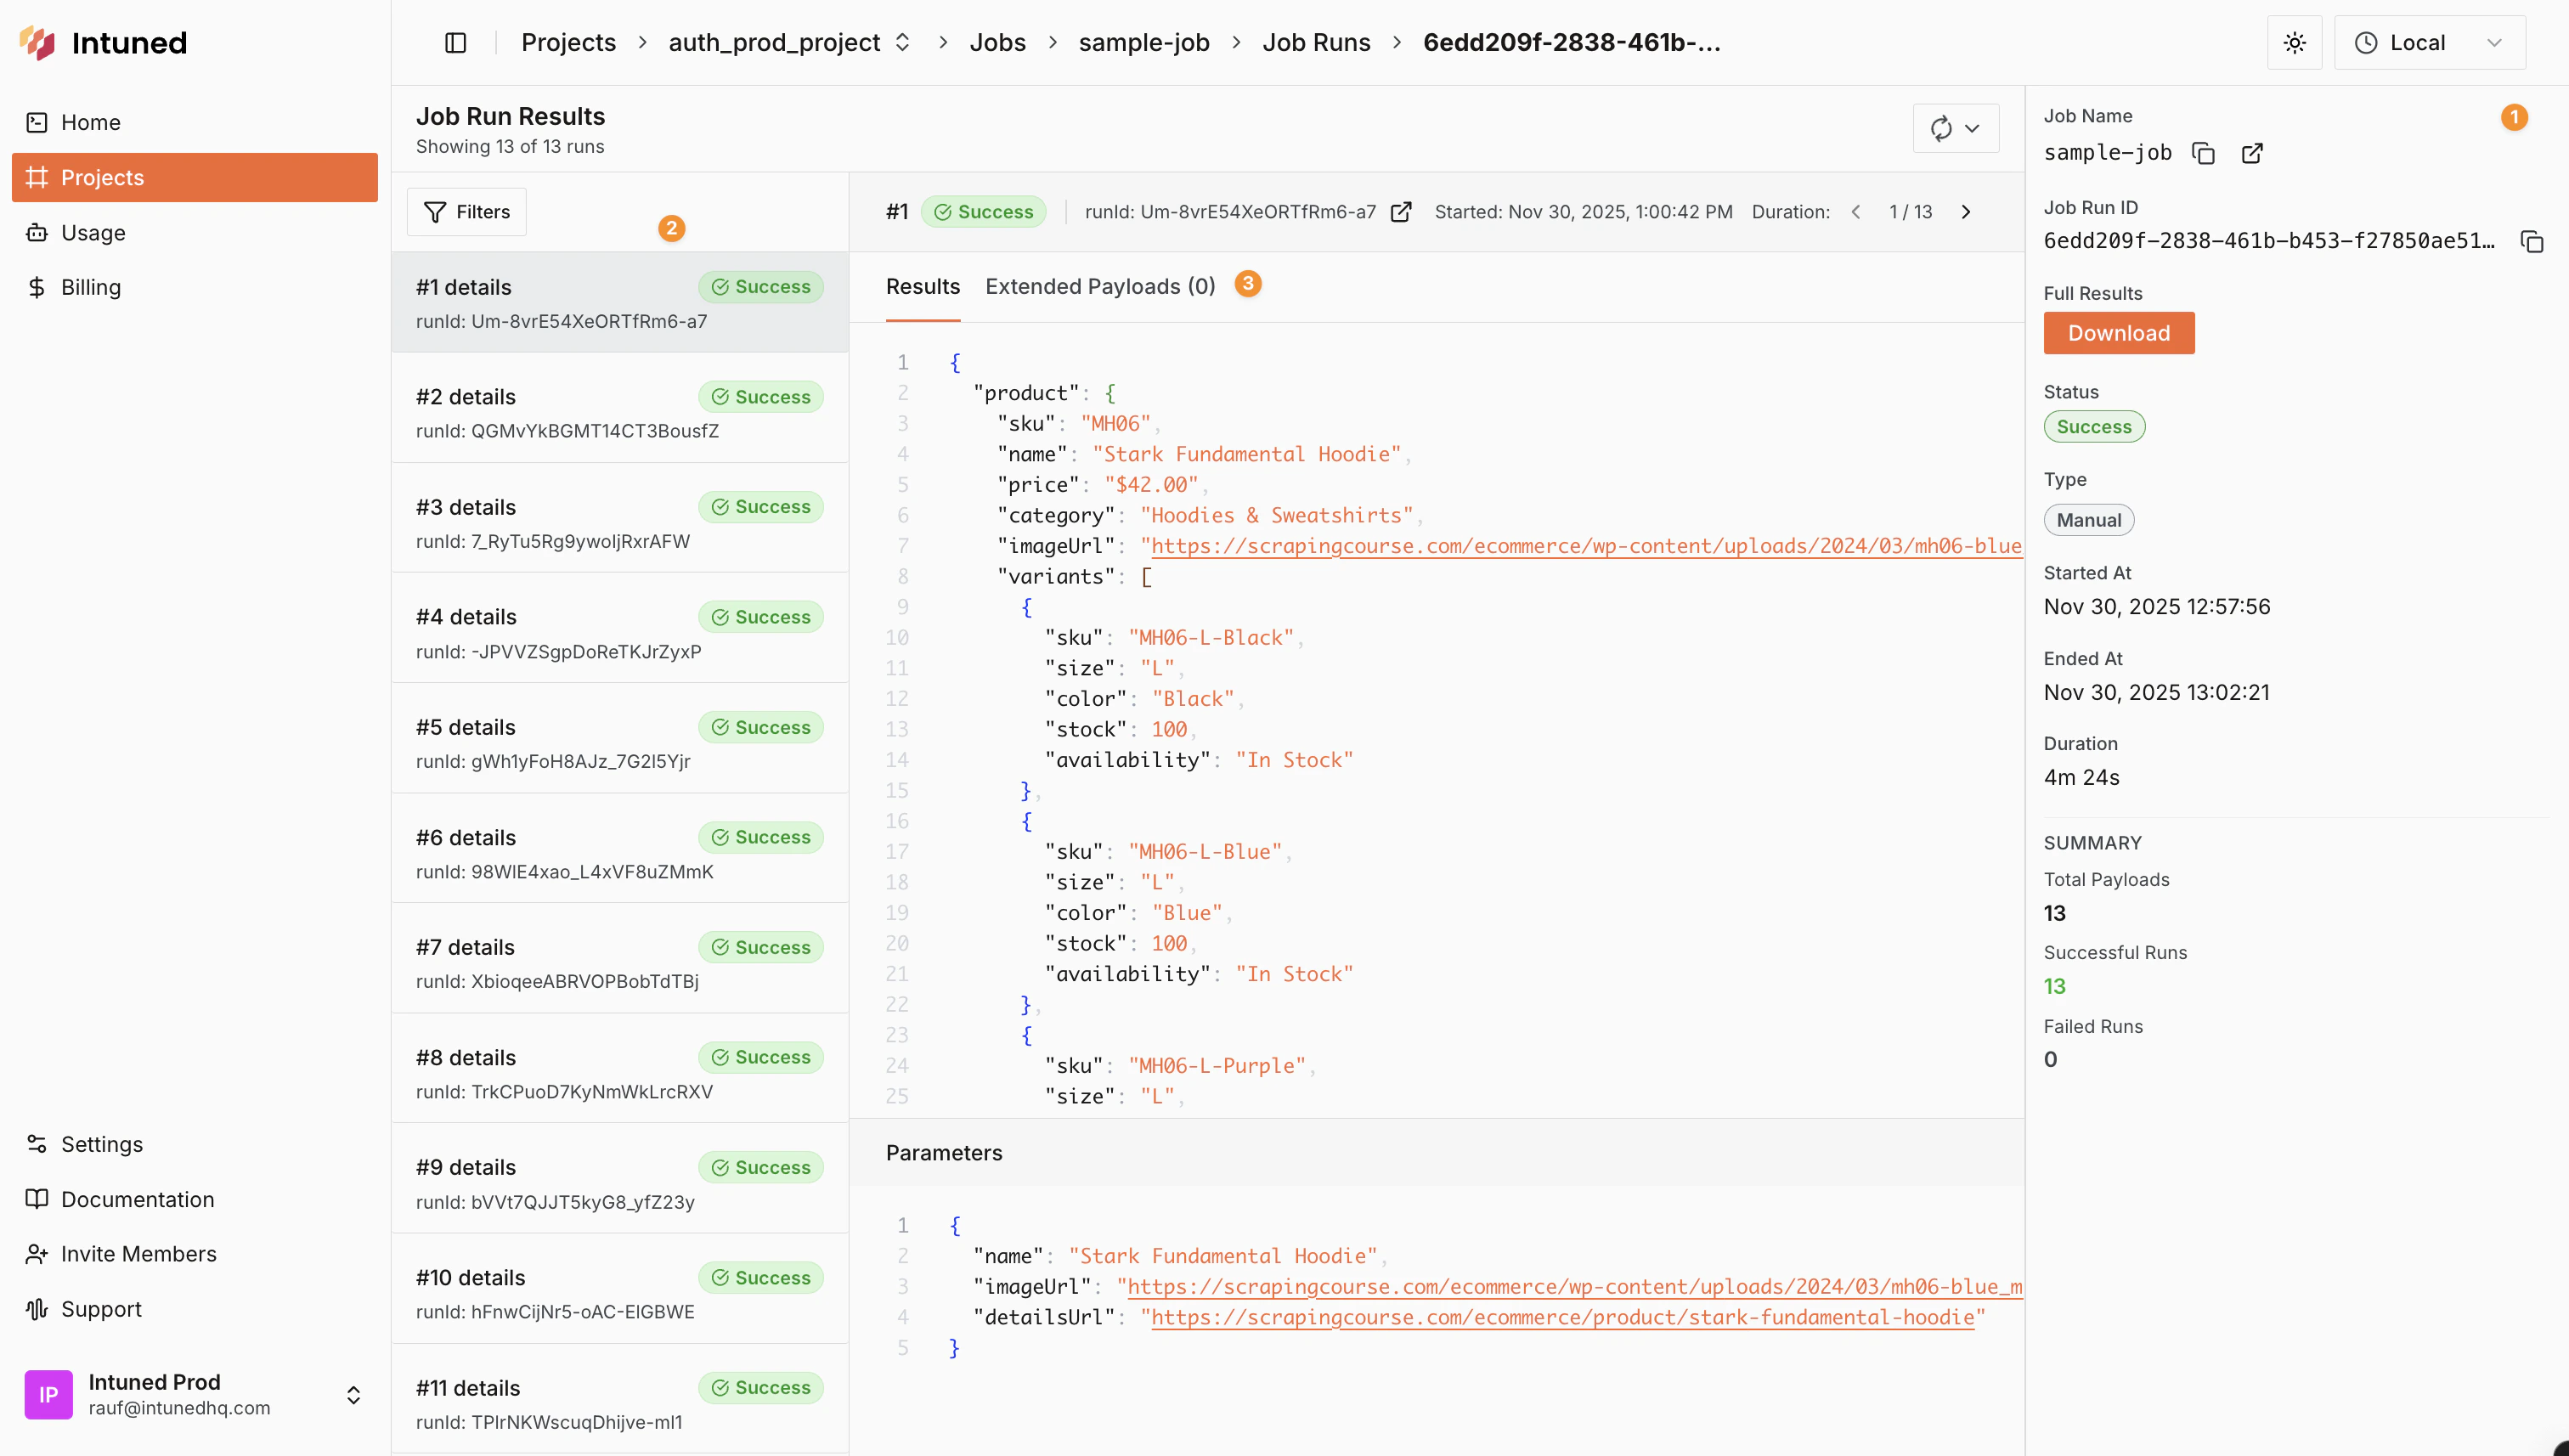 For each JobRun, you can see:
1. A detailed section with all JobRun information like status, start time, duration, summary of payloads executed, and more
2. A filterable list of all the API Runs that were part of this JobRun, including their statuses, durations, and timestamps
3. For each API Run within the JobRun, you can click on it to view its own Run details, with the result and parameters of this specific execution
Monitor JobRuns from the CLI. Run from your project directory or use `-p `:
```bash theme={null}
# List all JobRuns for a Job
intuned platform jobruns list
# Get details for a specific JobRun
intuned platform jobruns get
```
See [Job Runs List](/main/05-references/cli/platform#jobruns-list) and [Job Runs Get](/main/05-references/cli/platform#jobruns-get) for all options.
## Related resources
Understand error types and what they mean
Fetch Run details programmatically
Authenticated browser automations
Schedule and batch your automations
For each JobRun, you can see:
1. A detailed section with all JobRun information like status, start time, duration, summary of payloads executed, and more
2. A filterable list of all the API Runs that were part of this JobRun, including their statuses, durations, and timestamps
3. For each API Run within the JobRun, you can click on it to view its own Run details, with the result and parameters of this specific execution
Monitor JobRuns from the CLI. Run from your project directory or use `-p `:
```bash theme={null}
# List all JobRuns for a Job
intuned platform jobruns list
# Get details for a specific JobRun
intuned platform jobruns get
```
See [Job Runs List](/main/05-references/cli/platform#jobruns-list) and [Job Runs Get](/main/05-references/cli/platform#jobruns-get) for all options.
## Related resources
Understand error types and what they mean
Fetch Run details programmatically
Authenticated browser automations
Schedule and batch your automations