> ## Documentation Index
> Fetch the complete documentation index at: https://intunedhq.com/docs/llms.txt
> Use this file to discover all available pages before exploring further.
# How to QA automation results
## Overview
After building or updating an automation, you need to verify it works as expected. This guide shows you how to quickly QA your automation results using the Intuned dashboard.
You can consume a deployed project via [Runs](/main/02-features/runs-single-executions) (single executions) or [Jobs](/main/02-features/jobs-batched-executions) (batched executions).
## QA Runs
After triggering a Run, a new record appears in the **Runs** tab of your project.
From your project, open the **Runs** tab. You see a list of all Runs with key information like API name, start time, duration, and status.
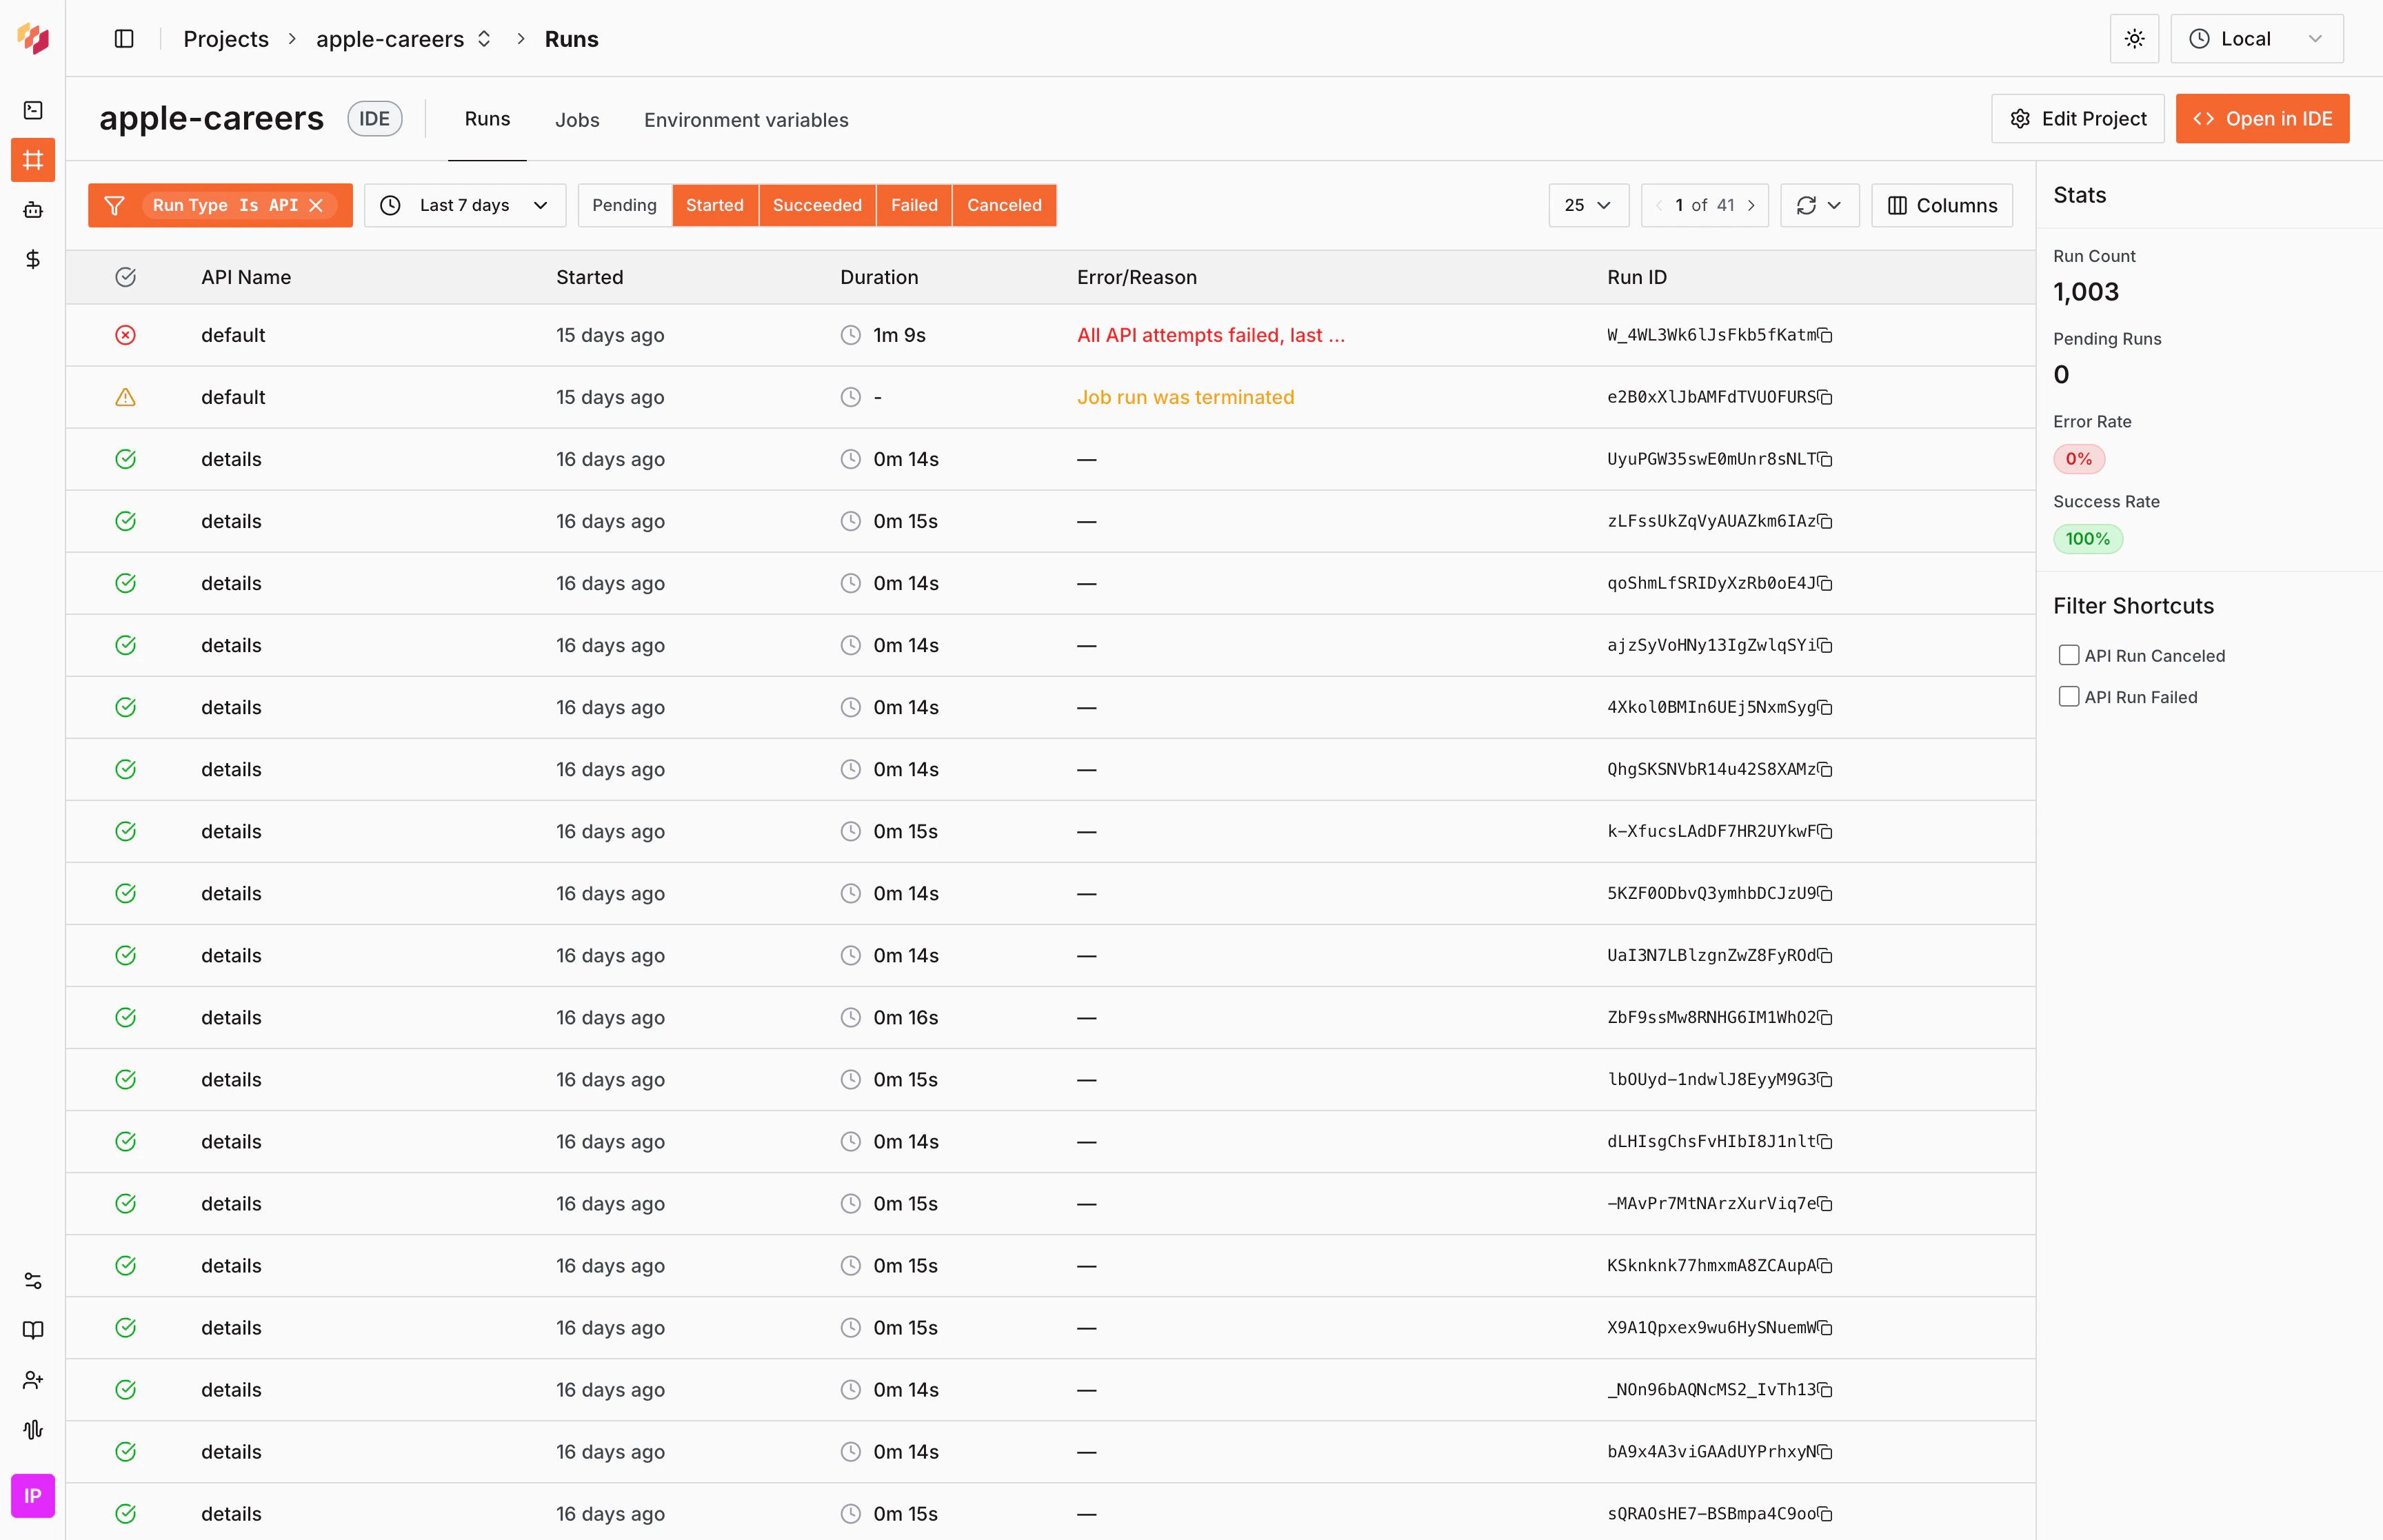 Look for the Run using the Run ID returned from your API call. Use the filters at the top to search by Run ID, API name, or status.
 Select the Run record to open the details page. This shows the complete information about that Run.
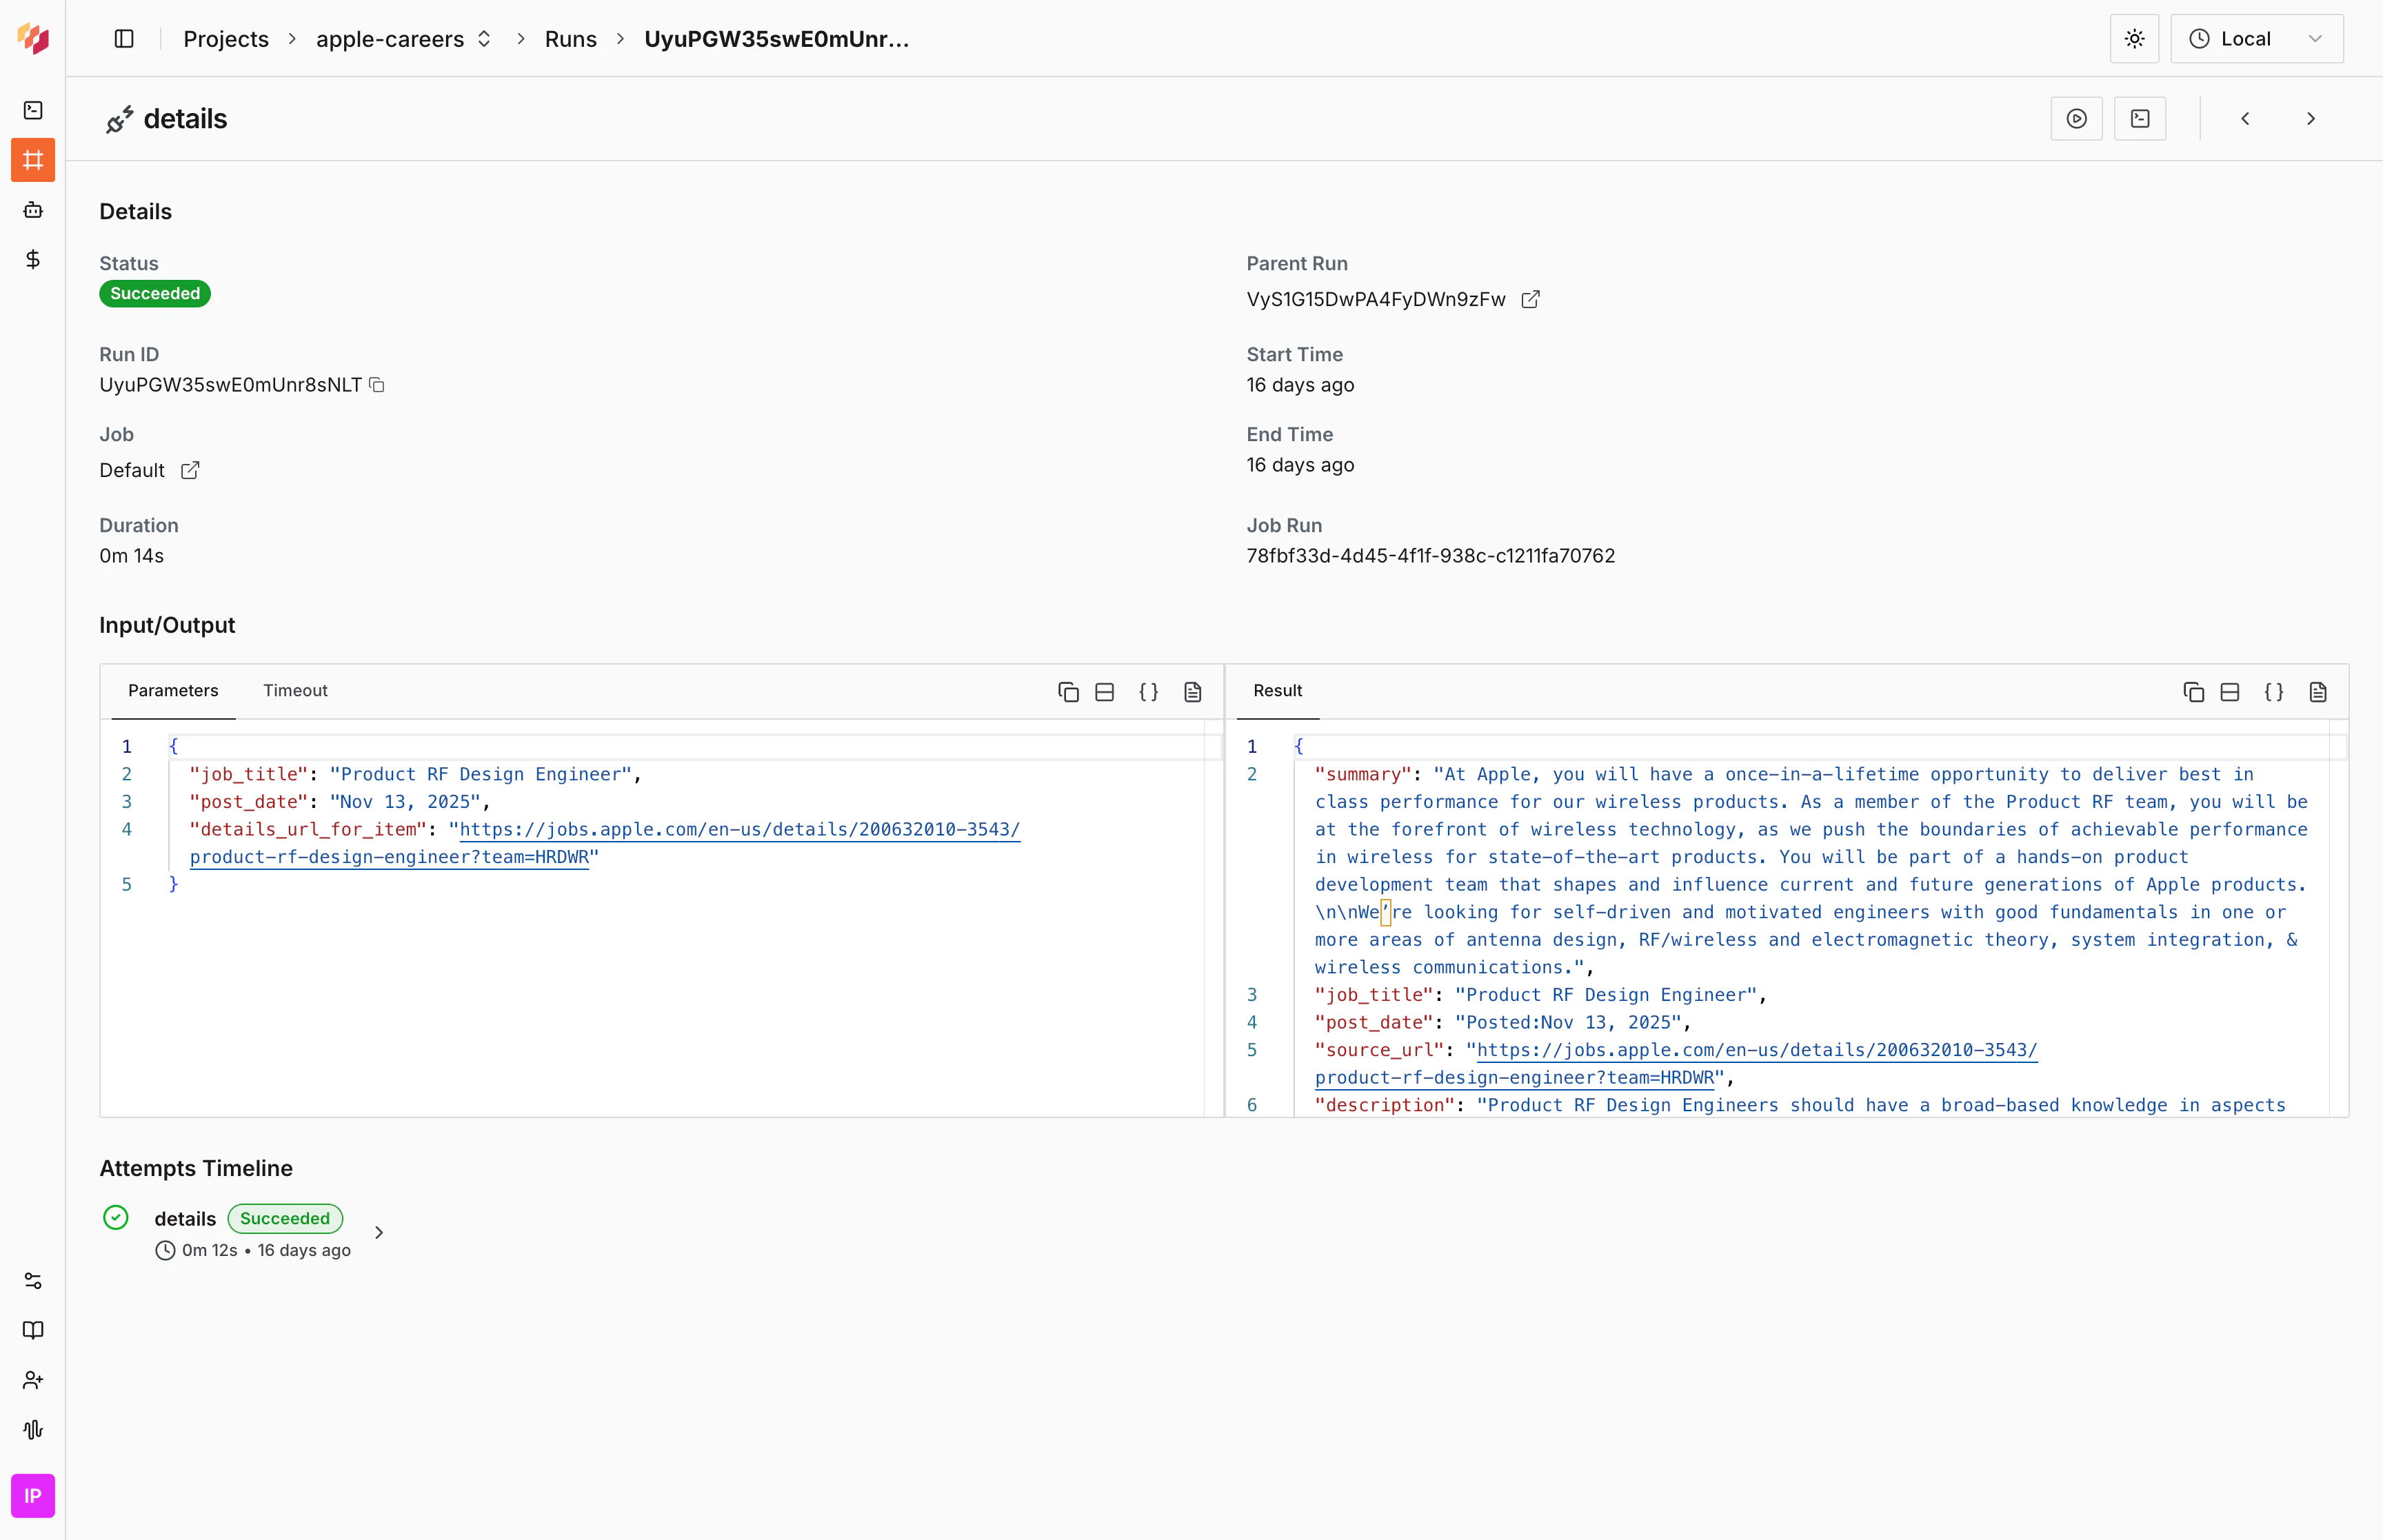 Review the JSON results in the **Result** tab to ensure the API returned the desired response. Verify that:
* All expected fields are present
* Data values are correct
* The structure matches your expectations
## QA JobRuns
From your project, open the **Jobs** tab. You see a list of all Jobs with a **Recent Job Runs** column showing quick stats for the latest JobRuns. Select the Job you want to QA.
Review the JSON results in the **Result** tab to ensure the API returned the desired response. Verify that:
* All expected fields are present
* Data values are correct
* The structure matches your expectations
## QA JobRuns
From your project, open the **Jobs** tab. You see a list of all Jobs with a **Recent Job Runs** column showing quick stats for the latest JobRuns. Select the Job you want to QA.
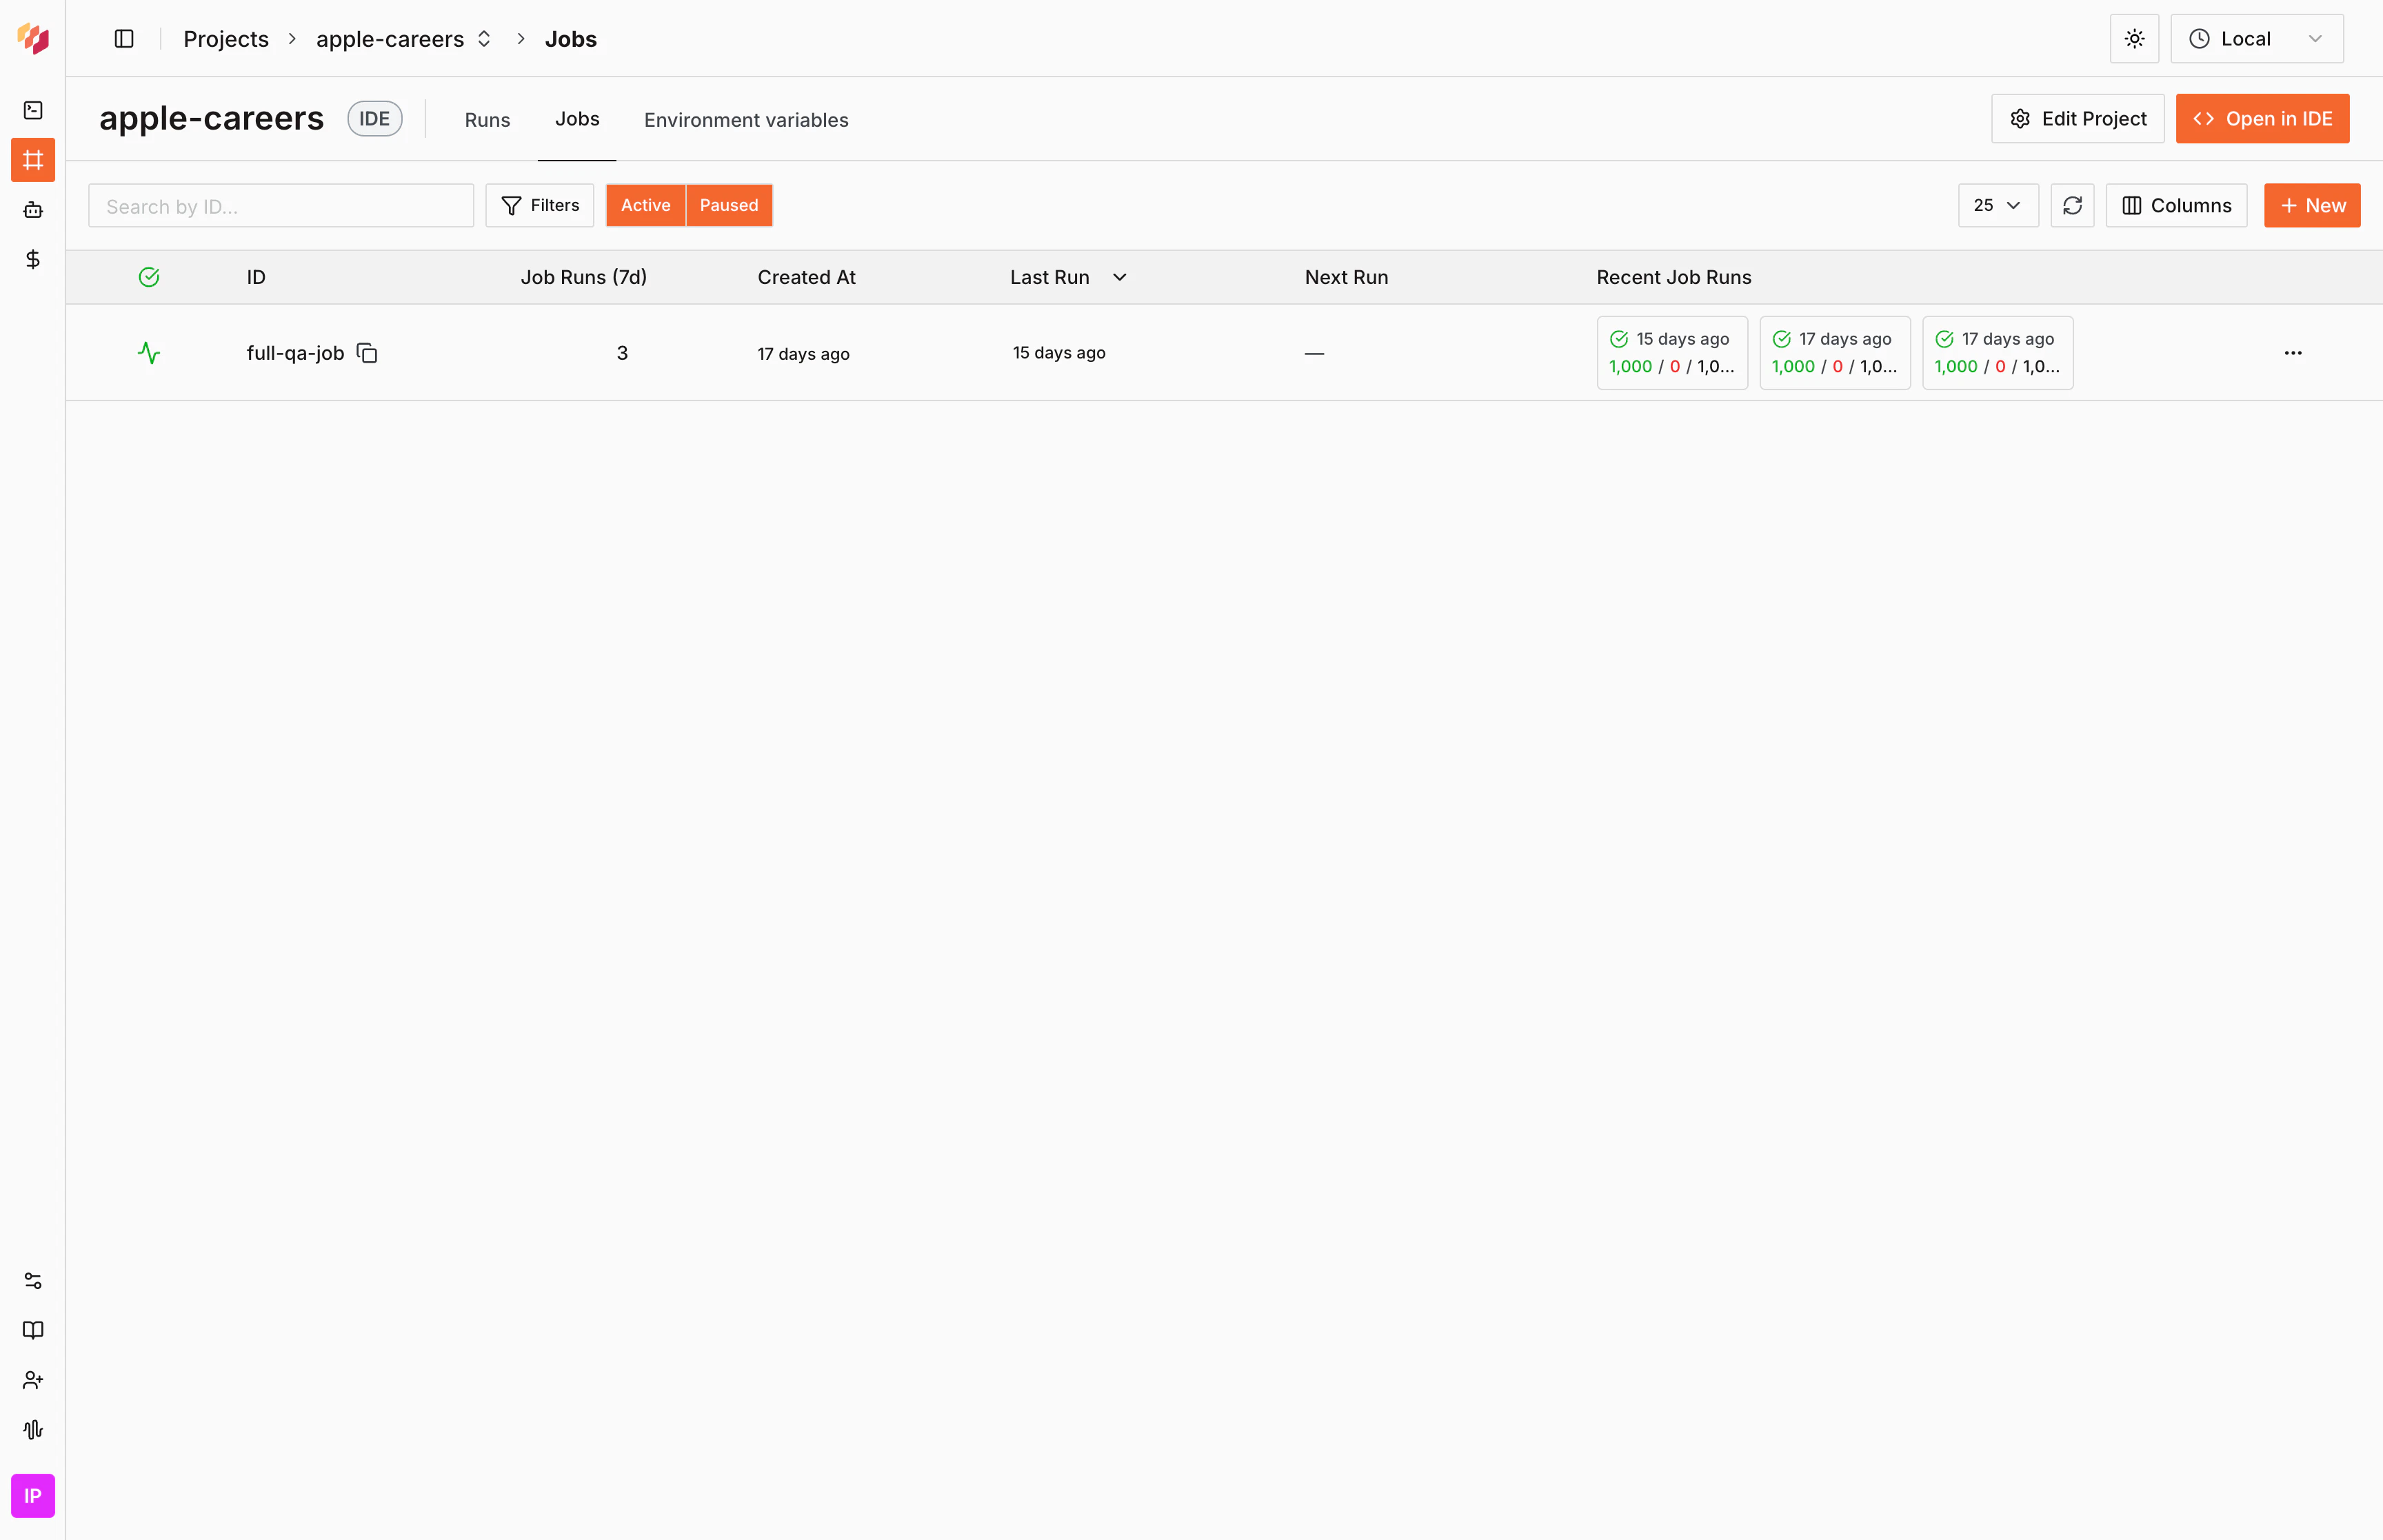 This opens the Job detail page showing all JobRuns with key metrics:
* **Duration** — How long each JobRun took
* **Payloads** — Total number of items processed
* **Success/Failure counts** — Quick health check for each Run
* **Status** — Whether the Run is Pending, Running, Completed, or Failed
This opens the Job detail page showing all JobRuns with key metrics:
* **Duration** — How long each JobRun took
* **Payloads** — Total number of items processed
* **Success/Failure counts** — Quick health check for each Run
* **Status** — Whether the Run is Pending, Running, Completed, or Failed
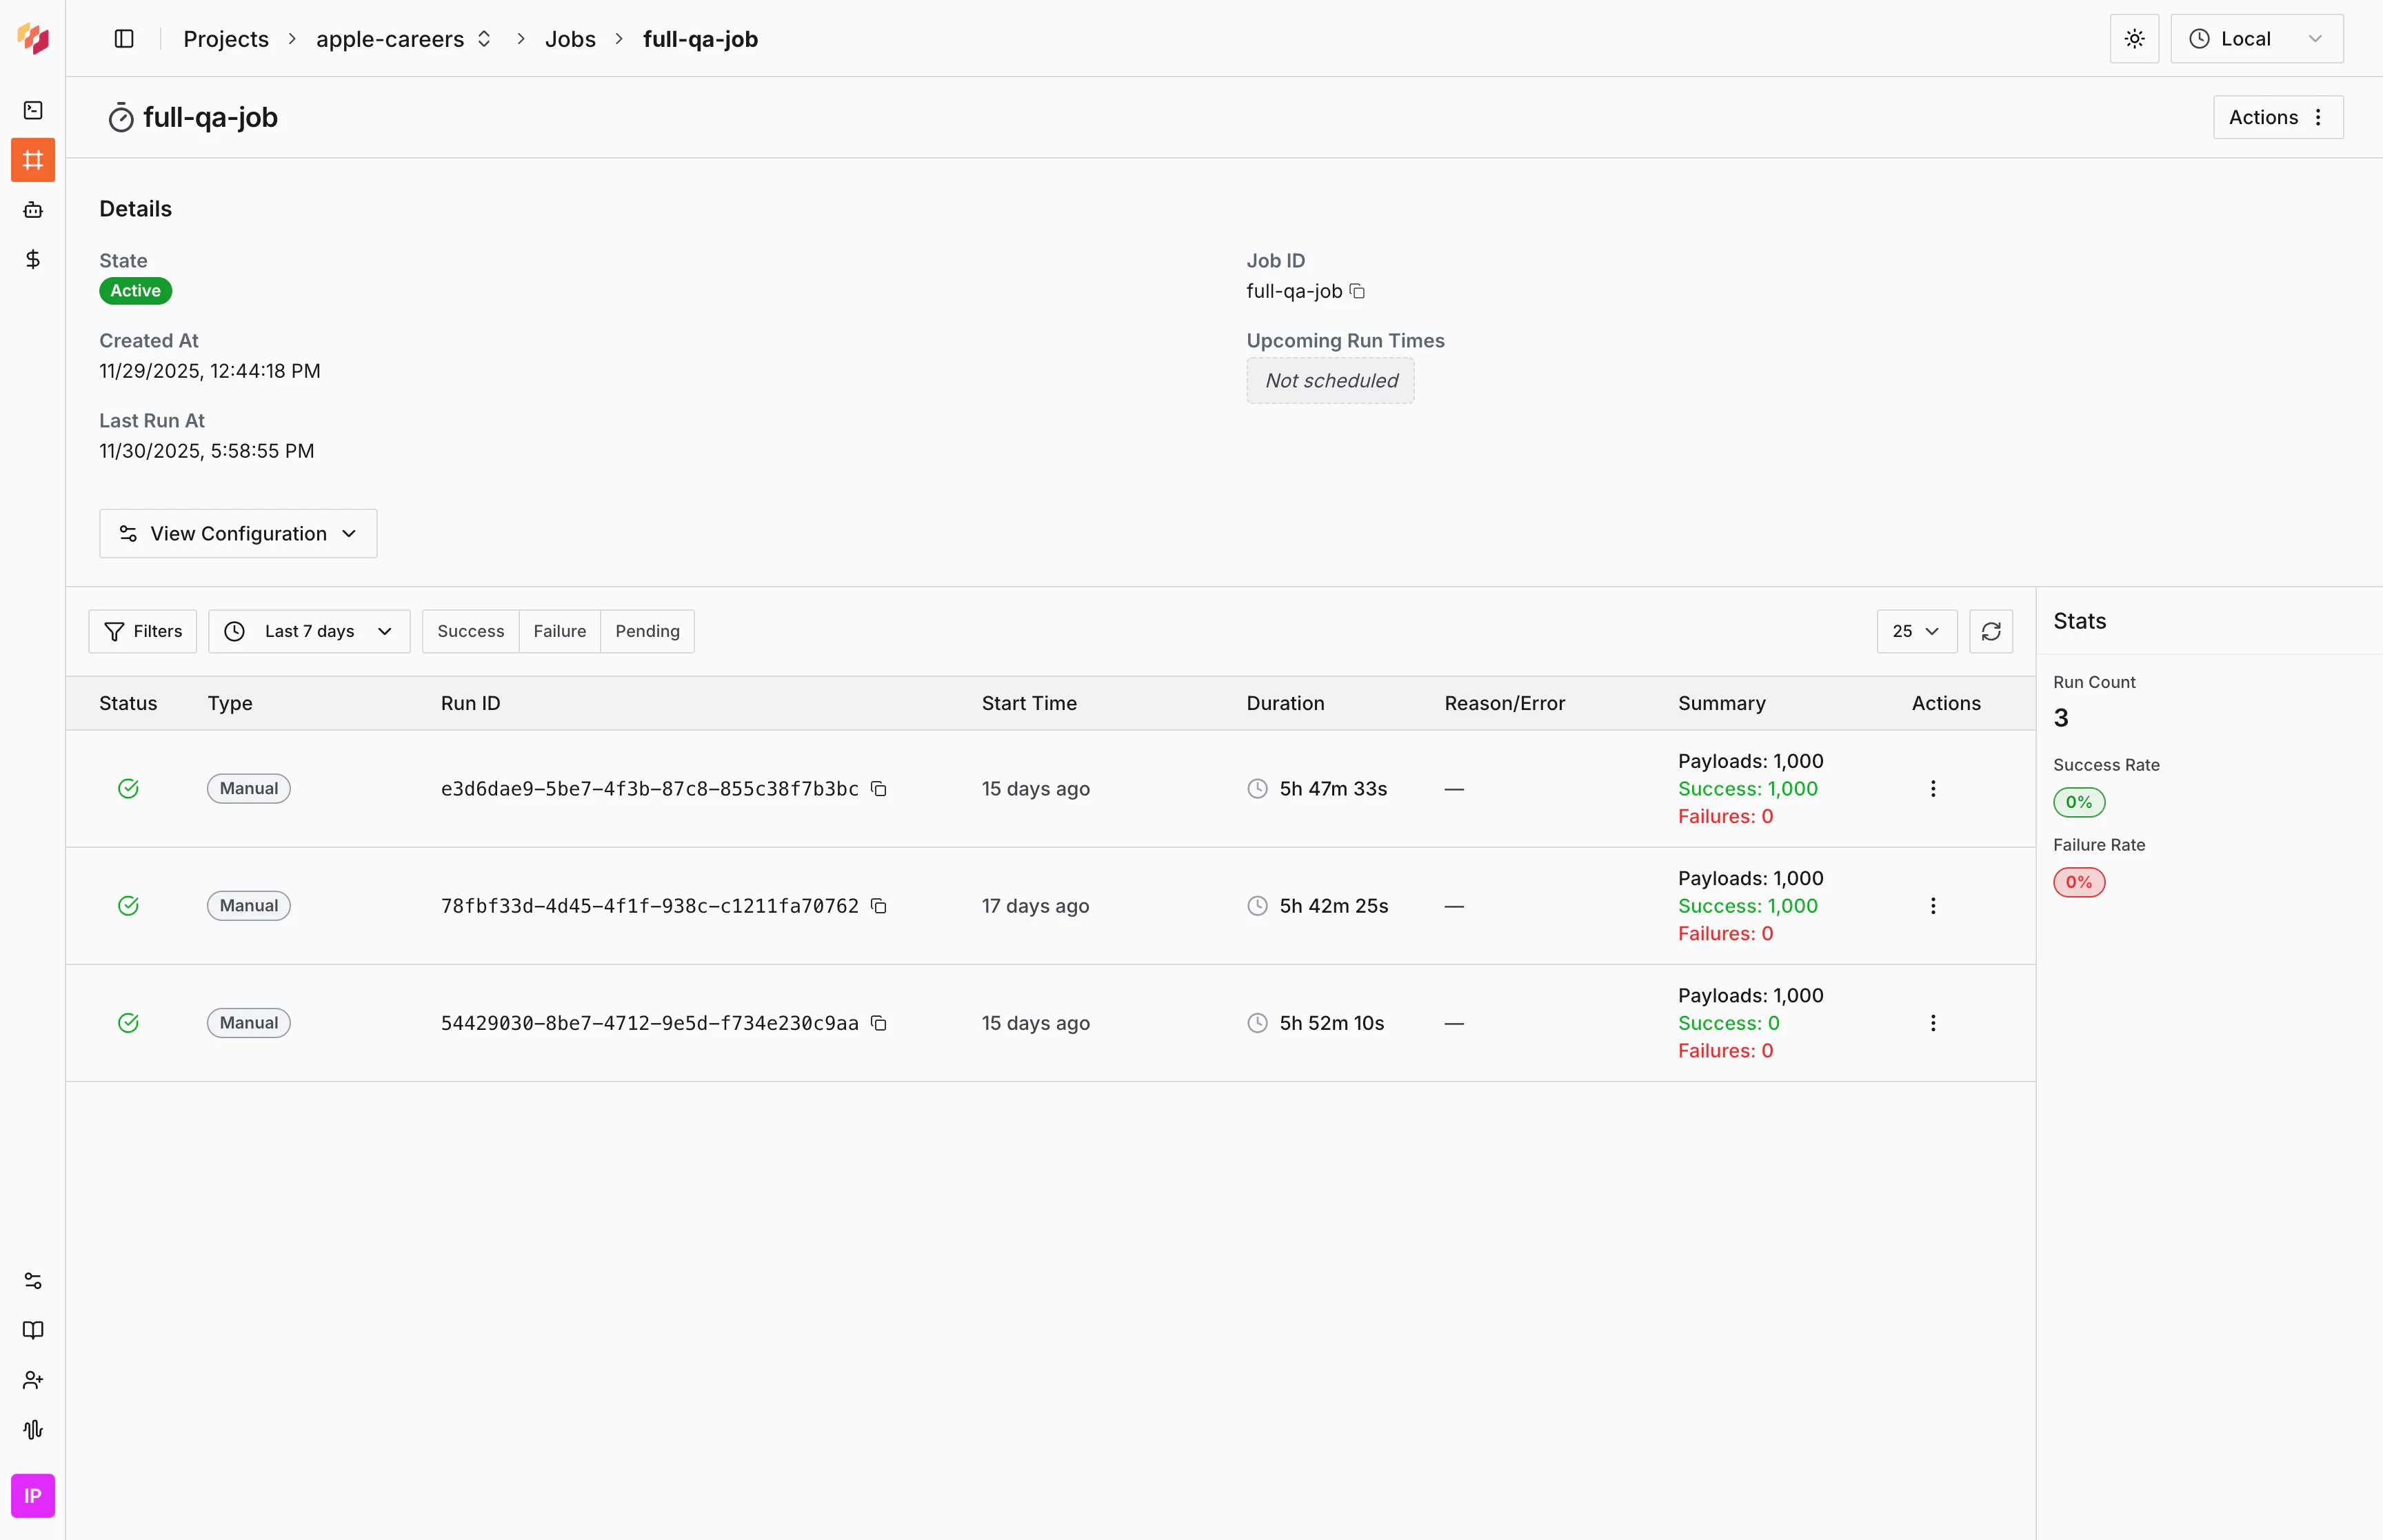 From the JobRuns page, you can quickly compare the current Run with previous Runs by looking at:
* **Duration** — Significant differences may indicate performance issues or changes in source data
* **Failure rate** — High failure counts compared to previous Runs suggest a problem
Select a JobRun row to see all the individual Runs executed as part of that Job.
From the JobRuns page, you can quickly compare the current Run with previous Runs by looking at:
* **Duration** — Significant differences may indicate performance issues or changes in source data
* **Failure rate** — High failure counts compared to previous Runs suggest a problem
Select a JobRun row to see all the individual Runs executed as part of that Job.
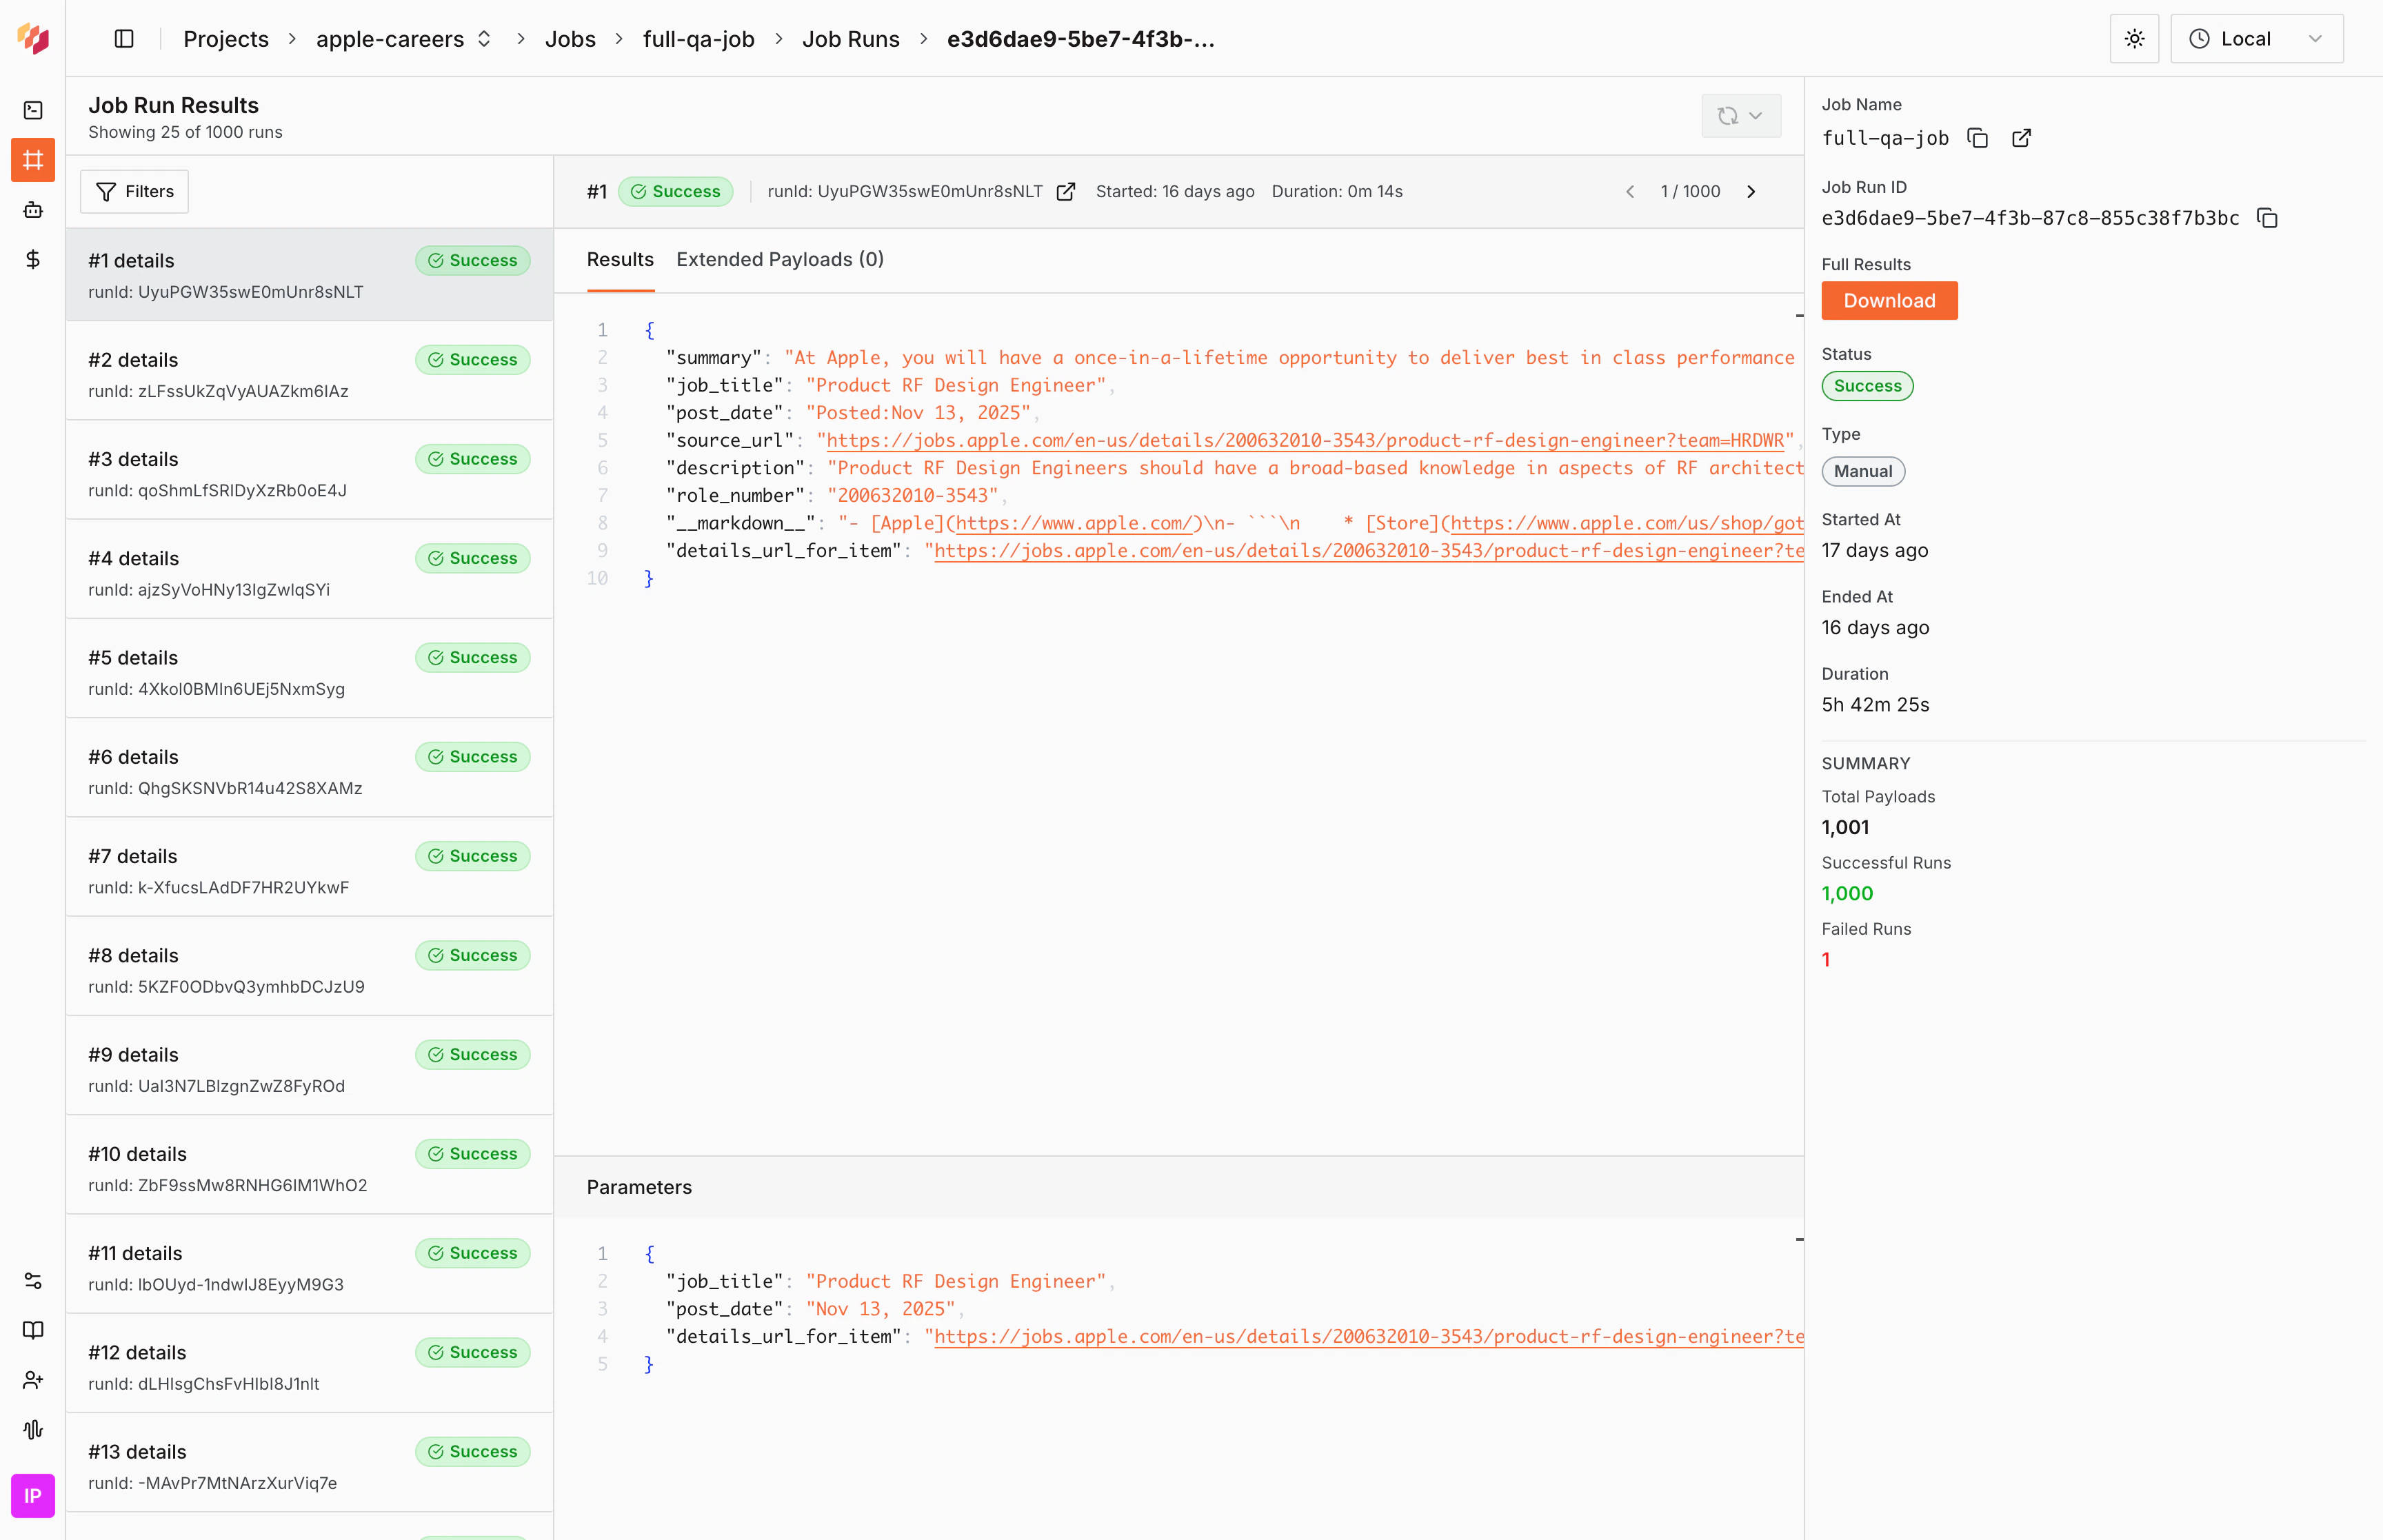
 Follow these steps to verify your scraper extracted data correctly:
1. **Verify completeness** — Confirm you captured all expected data:
* If your scraper extends APIs (e.g., a list API triggering detail calls), filter the table to find the extending API and check the **Extended Payloads** tab to verify items from both the beginning and end of the page were extracted
Follow these steps to verify your scraper extracted data correctly:
1. **Verify completeness** — Confirm you captured all expected data:
* If your scraper extends APIs (e.g., a list API triggering detail calls), filter the table to find the extending API and check the **Extended Payloads** tab to verify items from both the beginning and end of the page were extracted
 * If results are in a single Run, check the **Result** tab to verify all expected records are present
2. **Check the count** — Verify the number of items matches your expectations:
* For extended APIs: Look at how many detail Runs were triggered (should match the number of items on the page)
* For single-Run results: Count the items in the JSON array
3. **Spot check individual Runs** —
* If your automation has multiple Runs, select several random individual Runs to verify they contain the correct attributes and values
* If results are in a single Run, spot check random items in the JSON array
* If results are in a single Run, check the **Result** tab to verify all expected records are present
2. **Check the count** — Verify the number of items matches your expectations:
* For extended APIs: Look at how many detail Runs were triggered (should match the number of items on the page)
* For single-Run results: Count the items in the JSON array
3. **Spot check individual Runs** —
* If your automation has multiple Runs, select several random individual Runs to verify they contain the correct attributes and values
* If results are in a single Run, spot check random items in the JSON array
 **Extended APIs** occur when one API triggers multiple nested API calls. For example, a **list** API might trigger **details** API calls for each item in the list.
## Access Run details
Both standalone Runs and Runs within JobRuns share the same Run details page, which provides powerful debugging tools for investigating issues. For a comprehensive overview of debugging strategies, see [how to debug automations](/main/03-how-to/solve/debug-automations).
**To access Run details from a Job:**
1. Navigate to **Jobs** tab
2. Select a Job to view JobRuns
3. Select a JobRun row to see the Runs table
4. Select a Run row to expand details
5. Select the **Run ID** to open the full Run details page
**Extended APIs** occur when one API triggers multiple nested API calls. For example, a **list** API might trigger **details** API calls for each item in the list.
## Access Run details
Both standalone Runs and Runs within JobRuns share the same Run details page, which provides powerful debugging tools for investigating issues. For a comprehensive overview of debugging strategies, see [how to debug automations](/main/03-how-to/solve/debug-automations).
**To access Run details from a Job:**
1. Navigate to **Jobs** tab
2. Select a Job to view JobRuns
3. Select a JobRun row to see the Runs table
4. Select a Run row to expand details
5. Select the **Run ID** to open the full Run details page
 **To access Run details (standalone):**
* Select any Run ID from the **Runs** tab
### Run in IDE
If you need to debug a failed Run or investigate unexpected results, you can re-run it in the IDE with the exact same input parameters:
1. **Open the Run details page** — Select the Run ID to open the detailed view
2. **Select the Play icon** — In the Run details page, select the **Play** icon to launch **Run in IDE**
3. **Review the execution** — The [online IDE](/main/02-features/online-ide) opens with the Run's parameters pre-loaded and starts executing
**To access Run details (standalone):**
* Select any Run ID from the **Runs** tab
### Run in IDE
If you need to debug a failed Run or investigate unexpected results, you can re-run it in the IDE with the exact same input parameters:
1. **Open the Run details page** — Select the Run ID to open the detailed view
2. **Select the Play icon** — In the Run details page, select the **Play** icon to launch **Run in IDE**
3. **Review the execution** — The [online IDE](/main/02-features/online-ide) opens with the Run's parameters pre-loaded and starts executing
 This is especially useful for:
* Debugging failed Runs
* Investigating why certain results don't match expectations
* Testing fixes before redeploying
**Run in IDE** only works with [Hosted
projects](/main/02-features/online-ide).
### View trace in Playwright trace viewer
For deeper debugging, you can view detailed execution traces in Playwright's trace viewer:
1. **Open the Run details page** — Select any Run ID to open the detailed view
2. **Scroll down to the Attempts Timeline** — Find the attempts section showing all retry attempts for that Run
3. **Select an attempt** — Select any attempt to expand it, revealing additional details
4. **Select View Trace** — Select **View Trace** to open the Run in Playwright's trace viewer
This is especially useful for:
* Debugging failed Runs
* Investigating why certain results don't match expectations
* Testing fixes before redeploying
**Run in IDE** only works with [Hosted
projects](/main/02-features/online-ide).
### View trace in Playwright trace viewer
For deeper debugging, you can view detailed execution traces in Playwright's trace viewer:
1. **Open the Run details page** — Select any Run ID to open the detailed view
2. **Scroll down to the Attempts Timeline** — Find the attempts section showing all retry attempts for that Run
3. **Select an attempt** — Select any attempt to expand it, revealing additional details
4. **Select View Trace** — Select **View Trace** to open the Run in Playwright's trace viewer
 The trace viewer shows detailed debugging information including screenshots, network activity, console logs, and step-by-step execution flow. This is especially useful for debugging complex failures and understanding exactly what happened during execution.
## Red flags to watch for
When reviewing JobRuns, compare the current JobRun against previous JobRuns to identify issues:
* **Sudden drop in total Runs** — If the current JobRun has significantly fewer Runs compared to previous JobRuns (e.g., 50 Runs instead of the usual 200), this indicates missing data or pagination issues. Check if your list scraper correctly extracts all items.
* **High failure rate** — If the failure count is much higher than previous JobRuns (e.g., 30% failures vs the usual 2%), this suggests source website changes, bot detection, or code errors. Review failed Runs to identify patterns.
* **Significantly longer duration** — If the JobRun takes much longer than previous Runs (e.g., 10 minutes vs the usual 2 minutes), this indicates performance degradation or timeout issues. Check if the source website is slower or if your code has inefficiencies.
* **Missing first/last items** — When spot checking extended Runs, if you don't see items from the beginning or end of the expected list, this indicates incomplete page scraping. Your pagination or scrolling logic may not be working correctly.
* **Inconsistent attribute extraction** — If some Runs are missing attributes that were previously extracted, or returning null/undefined values, this suggests the source website's schema changed or your selectors need updating.
The trace viewer shows detailed debugging information including screenshots, network activity, console logs, and step-by-step execution flow. This is especially useful for debugging complex failures and understanding exactly what happened during execution.
## Red flags to watch for
When reviewing JobRuns, compare the current JobRun against previous JobRuns to identify issues:
* **Sudden drop in total Runs** — If the current JobRun has significantly fewer Runs compared to previous JobRuns (e.g., 50 Runs instead of the usual 200), this indicates missing data or pagination issues. Check if your list scraper correctly extracts all items.
* **High failure rate** — If the failure count is much higher than previous JobRuns (e.g., 30% failures vs the usual 2%), this suggests source website changes, bot detection, or code errors. Review failed Runs to identify patterns.
* **Significantly longer duration** — If the JobRun takes much longer than previous Runs (e.g., 10 minutes vs the usual 2 minutes), this indicates performance degradation or timeout issues. Check if the source website is slower or if your code has inefficiencies.
* **Missing first/last items** — When spot checking extended Runs, if you don't see items from the beginning or end of the expected list, this indicates incomplete page scraping. Your pagination or scrolling logic may not be working correctly.
* **Inconsistent attribute extraction** — If some Runs are missing attributes that were previously extracted, or returning null/undefined values, this suggests the source website's schema changed or your selectors need updating.